Abstract
Chilean avocado (Persea americana Mill.) exports have accounted for 60 % of the total production and are recognized for their high quality worldwide. However, avocado production has significantly decreased in recent years, which is mainly attributed to abiotic and biotic factors, among which are high and low temperatures, intense and sudden rains, unavailability of water resources, and agricultural salinity. Secondary factors include pests and diseases. Applying plant growth promoting microorganisms (PGPM)-based commercial biofertilizers is a potential practice to increase avocado production and resistance to edaphoclimatic factors. In this study, to determine the functionality of microbial communities present in three commercial biofertilizers (Biofert A, Biofert B, and Biofert C) and thus offer a structure of associated microbial communities, the rhizospheric soil of avocado was analysed using the Biolog EcoPlate™ technique, providing information on the community level physiologic profiles (CLPP) and biodiversity indices by denaturing gradient gel electrophoresis (DGGE). The findings revealed that the microbial diversity in the three commercial biofertilizers is highly different, showing a SIMPER overall dissimilarity of 83.9 % in the catabolic capacity. Concerning the impact on avocados’ rhizosphere soil bacterial communities, the results demonstrated significant changes in their composition, particularly with Biofert A and C. In contrast, Biofert B did not show significant changes, especially on days 15 and 30. Long-term studies are recommended to develop sustainable agricultural practices for Chilean avocados.
Introducción
Avocado ( Persea americana Mill.) is a widely consumed fruit for its organoleptic characteristics and an excellent source of nutritional value ( Flores et al., 2019 ; Pérez et al., 2015 ). Due to healthy eating trends, avocado consumption reached the highest growth concentration in different world markets per capita. The increase in global consumption is receiving special attention from avocado-exporting countries interested in entering or increasing their shipments to these markets ( Guzmán-Rodríguez et al., 2020 ; USDA, 2021 ). In this context, Mexico, the world’s leading producer, produced 2.41 MMT in the marketing year (MY) 2021/22, and for exports 1.35 MMT, which is equivalent to 40.9 % of global production in 2021, followed by other Latin American countries such as Peru, Chile, Colombia, and Dominican Republic ( USDA, 2021 ). In the MY 2021/22, Chile produced 2.2 MT of avocados and exported around 0.99 MT worldwide. However, a -33 % decrease has been recorded compared to the MY2020/21, which was 1.45 MT ( USDA, 2021 ). Thus, a reduction in avocado exportation has been mainly attributed to edaphoclimatic effects, including higher soil salinity and frost damage ( Bonomelli et al., 2018 ). Therefore, it is indispensable to investigate and address novel biotechnological strategies to promote avocado production and stress tolerance under new climate change scenarios ( Ferrer-Pereira et al., 2017 ).
In the last two decades, several studies have demonstrated the advantages of using plant growth-promoting microorganisms (PGPM) on plant growth and health under various environmental conditions ( Glick, 2012 ; Shumaila & Atia, 2019 ). Those potential PGPMs were selected and added as a main bioactive component in formulating commercial biofertilizers for sustainable practices ( Peter et al., 2020 ). In 2008, Chile’s Foundation of Agrarian Innovation launched a catalogue of commercial biofertilizers available for organic agriculture. Most PGPM-based commercial biofertilizers are imported from various countries, and Chilean companies sell them through local distributors. Several studies revealed that the PGPM isolated from one specific environmental condition may not function properly in another environment ( Compant et al., 2010 ). Foreign PGPM reintroduced into the soil could decline rapidly due to local environmental factors and native soil microflora. The adaptation capacity of introduced PGPM may not be similar under other agro-climatic conditions ( Díaz-Barrera & Soto, 2010 ). No studies have been conducted to the best of our knowledge, nor have they proved nor validated the effect of imported commercial biofertilizers under local agro-climatic conditions in Chile. Therefore, the efficiency of imported commercial bio-fertilizers on plant tolerance and their competency with native soil micro-flora must be investigated under various agro-climatic conditions.
Numerous studies have investigated the effect of agricultural practices on the abundance, composition, and activity of soil microbial communities ( Gomez & Garland, 2012 ). Nearly 90 % of soil microorganisms resist selective enrichment culture, and the typical conventional isolation methods are practically impossible to apply ( Ward et al., 1992 ). However, they can be identified by certain molecular approaches, such as polymerase chain reaction (PCR) and denaturing gradient gel electrophoresis (DGGE; Aude et al., 2004; Bei et al., 2015). Therefore, in this study, we determined the functionality of microbial communities present in three commercial biofertilizers. The structure of the microbial communities associated with the rhizospheric soil of the avocado was analysed using the Biolog EcoPlate™ technique, providing information on the community level physiologic profiles (CLPP) and biodiversity indices by DGGE. The hypothesis is that applying biofertilizers will positively influence the microbial diversity in soils grown with avocado.
Material and Methods
Commercial Biofertilizers
The PGPM-based commercial biofertilizers used in this study were supplied by three Chilean companies, as follows: (1) EM-1 ® (liquid form) supplied by Biopunto S.A., which contains photosynthetic bacteria ( Rhodopseudomonas plustris and Rhodobacter sphacerodes ), lactic acid bacteria ( Lactobacillus plantarum, L. casei, and Streptococcus lactis ), and fungi ( Apergillus spp . and Penicilium spp.); (2) Intro ® SL (liquid form) supplied by Agrotechnology S.A. which contains Rhizobium spp., Azotobacter spp., and Azospirillum spp, and (3) VITTA FERT ® (powder form) supplied by Rosario S.A which contains Azospirillum brasilense spp., Azotobacter chroococcum spp., Bacillus subtilis sp., Bacillus megaterium spp., Pseudomonas fluorescens spp., and Trichoderma spp.
The biofertilizer EM-1 ® is indicated as Biofert A, Intro ® SL as Biofert B, and VITTA FERT ® as Biofert C.
Isolation of Cultivable Microorganisms
The bacterial and fungal colonies were isolated from 1 mL of Biofert A and Biofert B and 1 g of Biofert C using serial dilution (10 -2 -10 -4 ) plating on Luria-Bertani medium (tryptone: 10 gL -1 ; yeast extract: 5 gL -1 ; NaCl: 10 gL -1 ; agar: 15 gL -1 ) for bacteria and on Potato Dextrose agar medium (potato infusion: 200 gL -1 ; dextrose: 20 gL -1 ; agar: 20 gL -1 ) for fungi ( Somasegaran & Hoben, 1994 ). Inoculated plates were incubated at 28 ± 2 °C, and colonies were counted after 4 days of incubation. Based on the colony morphology (size, colour, shape, texture, and growth pattern), the individual colonies were selected, followed by purification on the same solid media with a repeated plating method ( Schmidt & Belser, 1982 ).
DNA Isolation
DNA from commercial biofertilizers was isolated using the modified protocol of Jorquera et al. (2010 ). The bacterial cells in 10 mL of three commercial biofertilizers were collected by centrifugation (20 min, 10,000× g ). The aqueous fluid was removed, and the rest of the tube contents were washed repeatedly in sterile saline solution (0.85 % NaCl) and then lysed by freezing-thawing. The total genomic DNA was extracted using the Ultraclean Microbial DNA Isolation Kit supplied by Mo Bio Laboratories, Inc. The 16S rRNA fragments were amplified by touchdown PCR with the primer set of EUBf933-GC/EUBr1387, which amplifies a 454 bp fragment of the 16S rRNA gene ( Iwamoto et al., 2000 ). The thermocycling program was as follows: 1× (10 min, 95 °C), 20× (65 °C, -0.5 °C/cycle up to 55°C), 1× (3 min, 72 °C), 10× (1 min, 94 °C, +3 min/cycle, 72 °C), and 1× (7 min, 72 °C).
The PCR products were subjected to DGGE analysis using a DCode system (Bio-Rad). Twenty µl of the PCR product were loaded onto a 6 % (w/v) polyacrylamide gel with a 50-70 % gradient of denaturing chemicals with 7 M urea and 40 % formamide. The electrophoresis was run for 16 h at 100V. The DNA was visualised after SYBR Gold (Molecular Probes, Invitrogen Co.) staining by UV transillumination.
Community-level Physiological Profiles
The metabolic structure of microbial communities in commercial biofertilizers was examined by obtaining the CLPPs using EcoPlate™ (BioLog®, CA, USA). To generate microbial suspensions, 1 mL of Biofert A and Biofert B and 1 g of Biofert C were agitated at 150 rpm and 25 °C for 1 h in 10 mL of PBS buffer (137 mM NaCl; 2.7 mM KCl; 8 mM Na 2 HPO 4 ; 2 mM KH 2 PO 4 ). Then, Biofert C suspension was filtrated, and 100 μL of each suspension was inoculated in each well of the corresponding microplate and incubated at 25 °C for 7 days in a humid chamber. Microbial community consumption of the carbon sources reduced a tetrazolium dye, whose purple colouration was measured daily at 590 nm in an Epoch microplate reader (Biotek). The data were processed by subtracting the absorbance value at time zero to minimize the interference of the sample colour ( Insam & Goberna, 2004 ; Li et al., 2015 ) and the absorbance value from the control (water). In the data analysis, absorbance values of 0.1 or higher were considered positive according to the detection limit of the reader.
Based on metabolic fingerprinting data, the structure of the microbial community was calculated using the Shannon (H’) index. On the other hand, the similarity between the microbial community of commercial biofertilizers, considering their metabolic structures, was determined by principal component analyses (PCAs) based on the Bray-Curtis dissimilarity index. In addition, ANOSIM and SIMPER analyses of similarity were calculated. All these analyses were done using PAST software v 3.11 ( Hammer et al., 2001 ).
Soil Sampling
Rhizosphere soil samples were collected from the avocado orchard belonging to Jorge Schmidt & Cia, located in the Aconcagua Valley (32°47′05’’S and 70°47′31’’ W), Valparaíso, Chile. The orchard of avocado var. Hass had a conventional farming management. Soil samples were collected randomly from three healthy avocado trees. Two soil samples per tree were taken in the drip irrigation area at a depth no greater than 15 cm, and there was a separation between the sampled areas of 2.5 km. Soil samples were stored in high-density polyethylene bags, taken carefully to the laboratory, and stored at 4 ºC for later use.
Pot-soil Experiment
The rhizosphere soil of avocado was air-dried, passed through a 2-mm sieve, and analysed for physico-chemical characteristics before filling the pots ( Aguilar et al., 1988 ). The soil was sandy loam (sand: 62.14; silt: 22.77; clay: 15.09) with the following characteristics: EC (millimmho s/sc) = 2.14; saturation (%) = 31.5; field capacity (%) = 42.33; organic matter (%) = 1,088: N-NO 3 = 1.09; P = 3.1 in ppm (Kg ha soil -1 )); permeability K (cm/h) = medium-high 12.5; exchangeable cations (%): Ca = 250; Na = 75, and pH of 6.7. The experiment is a complete block design, which includes the soils treated with three commercial biofertilizers plus a non-treated control with three replicates. Briefly, the pots were inoculated with the three commercial biofertilizers only once at the beginning of the experiment at the rate of 0.2 mL pot -1 (Biofert A and Biofert B) and 0.32 g pot -1 (Biofert C), respectively, according to the manufacturer’s recommended rate. The uninoculated pots were irrigated with sterile distilled water. Later, sterile distilled water was added on alternative days to maintain the soil moisture. The pots were maintained under controlled conditions at 21-25 °C, 60 % RH, and 8:16 h light:dark cycle for 30 days. Samples were collected from each pot on days 3, 7, 15, and 30 and stored at 4 °C for further analysis.
Changes in rhizobacterial community composition
The effect of Biofert A, B, and C on the rhizosphere bacterial communities of the avocado was studied by DGGE analysis. Briefly, 0.25 g of rhizosphere soil samples were collected from each pot on days 3, 7, 15, and 30 after the inoculation of commercial biofertilizers. According to the manufacturer’s instructions, the total soil DNA was extracted using the PowerSoil® DNA Isolation Kit. The PCR amplification and DGGE analysis for bacteria was briefly described in the previous section. DGGE images were first analysed using Phoretix 1D Pro Gel Analysis Software (TotalLab Ltd., Newcastle, UK; http://totallab.com/) to determine the significant difference between biofertilizer treatments. Based on the matrix given by Phoretix 1D analysis, changes in the bacterial communities in biofertilizer-amended rhizosphere soil samples were calculated by similarity profile analysis (SIMPROF test) with a Bray-Curtis similarity index, 5 % significance level, and <0.1 stress values and visualized by non-metric multidimensional scaling (NMDS) analysis using Primer 6 software (Primer-E Ltd., Ivybridge, UK; http://www.primer-e.com/ ).
Results and Discussion
| Biofert A | 7.56 ± 0.60b* | 5.73 ± 0.05a |
| Biofert B | 7.37 ± 0.13c | - |
| Biofert C | 8.09 ± 0.02a | 4.9 ± 0.09b |
| Biofert A × B | 0.5656 | 0.0014 | 83.9 |
| Biofert A × C | 0.8183 | 0.0009 | 91.2 |
| Biofert B × C | 0.7532 | 0.0008 | 79.2 |
| Biofert A × B × C | 0.6847 | 0.0001 | 83.9 |
Isolation of Cultivable Microorganisms
Studies performing isolation and characterization of PGPM from commercial biofertilizers are minimal ( Azizoglu, 2019 ; Mitra et al., 2023 ). Our study isolated culturable PGPM (bacteria and fungi) in three commercial biofertilizers (Biofert A-C). The total colony counts of bacteria and fungi isolates are presented in Table 1 . There was a significant difference in bacterial and fungal populations among the three commercial biofertilizers observed. The highest bacterial counts were identified in Biofert C (8.09 ± 0.02) compared to Biofert A and B (7.56 ± 0.60 and 7.37 ± 0.13, respectively). In contrast, higher fungal counts were found in Biofert A (5.73 ± 0.05) than in Biofert C (4.9 ± 0.09). On the other hand, no fungal growth was observed in Biofert B. Higher bacterial counts in Biofert C compared with two liquid Biofert A and B could be due to the ageing of compost during which the readily available fractions of carbon deplete ( Diacono et al., 2019 ; Prajna et al., 2022 ).
In contrast, adding beneficial fungi to microbial foods favouring substances, such as molasses, must be the reason for higher fungal counts in Biofert A ( Megali et al., 2014 ) than in Biofert C. The bacterial population in the liquid Biofert A and B showed no heterogeneity concerning colony morphology (data not shown). The majority of the bacterial population was dominated by white, irregular, opaque colonies in Biofert A and B. Based on morpho-types and showing prolific growth on nutrient agar medium, a total of 67 isolates of bacteria (Biofert A: 12; Biofert B: 13; and Biofert C: 42) and ten fungal colonies (Biofert A: 4 and Biofert B: 6) were selected and purified.
Table 1 Colony-forming units of potential PGPM (bacteria and fungi) present in three commercial biofertilizers Biofertilizers Bacteria (CFU log 10) Fungi (CFU log 10) Biofert A 7.56 ± 0.60b* 5.73 ± 0.05a Biofert B 7.37 ± 0.13c - Biofert C 8.09 ± 0.02a 4.9 ± 0.09b *Values represent mean ± standard deviation ( n = 3). Different letters in a column denote significant differences ( P ≤ 0.05; Tukey’s test) among the three commercial biofertilizers (A, B, and C). Source: Prepared by the authors.
| Biofert A | 7.56 ± 0.60b* | 5.73 ± 0.05a |
| Biofert B | 7.37 ± 0.13c | - |
| Biofert C | 8.09 ± 0.02a | 4.9 ± 0.09b |
Total Bacterial Community Composition
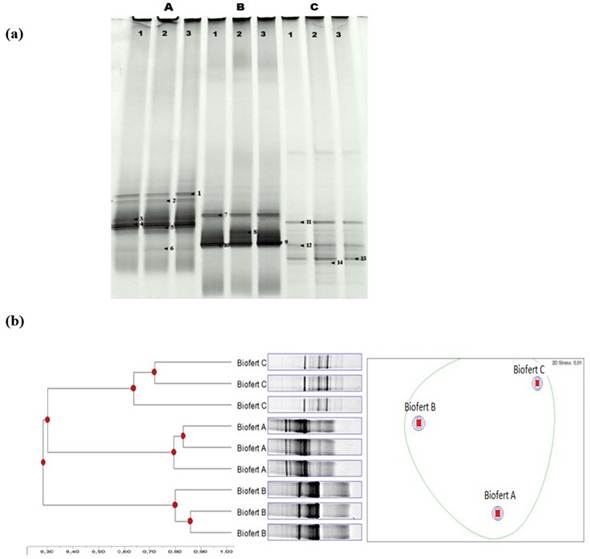
The banding patterns of bacterial diversity between the commercial biofertilizers were highly different ( Figure 1 a). For bacteria, 14 dominant bands were scored in total (Biofert A: 1-6; Biofert B: 7-10; Biofert C: 11-14). The dendrograms and MDS analysis describing the presence of bacterial population in three commercial biofertilizers are shown in Figure 1 b. The MDS analysis showed that the bacterial communities in three commercial biofertilizers were significantly different (5 % level), ( Figure 1 b).
Community-level Physiological Profiles
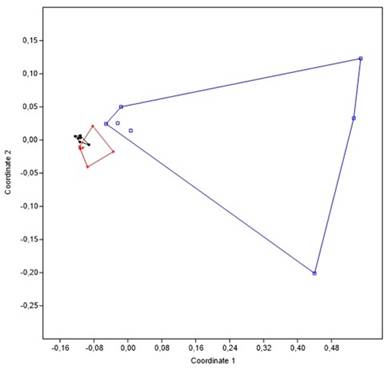
Biolog data represent the metabolic profile of microorganisms ( Suprokash et al., 2022 ) in three commercial biofertilizers (Biofert A-C). The data obtained by EcoPlate™ (BioLog®) showed significant differences in the commercial biofertilizers ( Figure 2 ) in an ANOSIM analysis ( R = 0.6847). Similarly, the grouping of three commercial biofertilizers showed a SIMPER overall dissimilarity of 83.9 % ( Table 2 ). However, the principal component analysis revealed two distinct clusters, with Biofert A and B separated from Biofert C. This result confirms a significant difference in the catabolic capacity of microbial communities among commercial biofertilizers ( Figure 2 ). The relativity of liquid cultures (Biofert A and B) within either group indicates that the functional groups of microbiota present in each biofertilizer might possess similar substrate utilization potential ( Shrestha et al., 2019 ). Then, data were grouped between every two biofertilizers (Biofert A x Biofert B; Biofert A x Biofert C; Biofert B x Biofert C), and results of ANOSIM and SIMPER analysis of the grouped CLPP data are shown in Table 2 .
Figure 1 (a) DGGE banding patterns of the bacterial communities present in Biofert A (A), Biofert B (B) and Biofert C (C). (b) Dendrogram and non-metric multidimensional scaling (MDS) analysis of DGGE profiles (16S rRNA gene) from bacterial communities of three commercial biofertilizers (A, B, and C). Source: Prepared by the authors.
The metabolic profiles showed significant differences when every two biofertilizers were grouped. The highest values of R in the ANOSIM analysis were observed within the group Biofert A x Biofert C ( R = 0.8183) in comparison with Biofert B x Biofert C (0.7532) and Biofert A x Biofert B (0.5656). Similarly, the group Biofert A x Biofert C showed a SIMPER overall dissimilarity of 91.2 %. In contrast, the group Biofert A x Biofert B showed a higher SIMPER overall dissimilarity of 83.9 % than the group Biofert B x Biofert C (79.2 %).
Table 2 Metabolic structure (CLPP) data grouping analysis including results of ANOSIM (R and p-values) and SIMPER (% of dissimilarity) multivariate analysis of samples grouped into every two biofertilizers Grouped by ANOSIM R ANOSIM p SIMPER dissimilarity (%) Biofert A × B 0.5656 0.0014 83.9 Biofert A × C 0.8183 0.0009 91.2 Biofert B × C 0.7532 0.0008 79.2 Biofert A × B × C 0.6847 0.0001 83.9 Source: Prepared by the authors.
Figure 2 Multivariate PCA of the metabolic structures of the microbial communities present in three commercial biofertilizers (Biofert A-C). Profiles were obtained for each sample by CLPP using EcoPlate™ (BioLog®). Biofert A is indicated with black circles, Biofert B with red circles, and Biofert C with blue circles.
| Biofert A × B | 0.5656 | 0.0014 | 83.9 |
| Biofert A × C | 0.8183 | 0.0009 | 91.2 |
| Biofert B × C | 0.7532 | 0.0008 | 79.2 |
| Biofert A × B × C | 0.6847 | 0.0001 | 83.9 |
Changes in Taxonomic Composition of Rhizosphere Microbial Communities
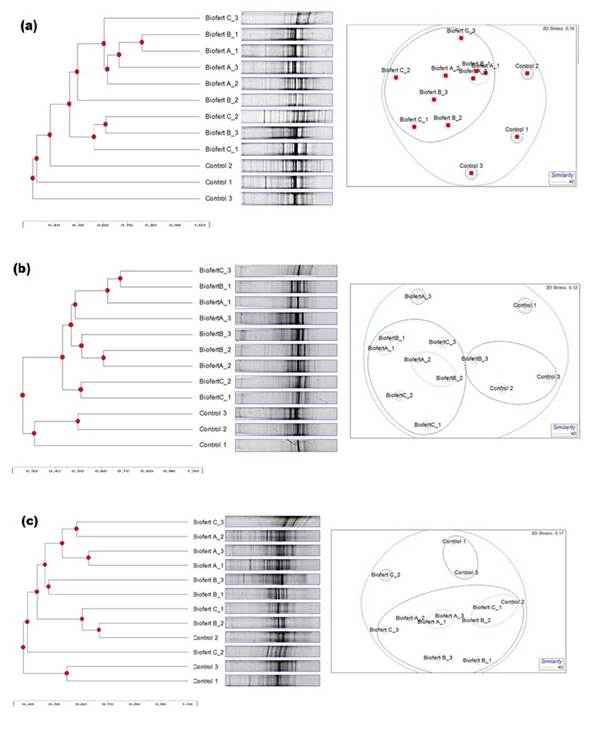
The dendrogram and MDS analysis describing the effect of commercial biofertilizers on ribotypes (16S rRNA gene) of rhizobacterial community in avocado soils on days 3, 7, 15, and 30 are shown in Figure 3 a-d. The MDS analysis showed a significant difference among the treatments inoculated with Biofert A, B, and C and uninoculated control on day 3 ( Figure 3 a).
Figure 3 Dendrograms and non-metric multidimensional scaling (MDS) analysis of DGGE profiles from rhizobacterial communities of avocado soils amended with Biofert A-C on (a) day 3, (b) day 7, (c) day 15, and (d) day 30. Source: Prepared by the authors. /
Certainly, the MDS analysis revealed that the soil treated with Biofert B did not induce significant changes in rhizobacterial communities compared with uninoculated control ( Figure 3 b). However, other than Biofert B treatment, a significant difference in bacterial communities was observed among all treatments on day 7. In contrast to days 3 and 7, the MDS analysis showed no significant changes in the rhizobacterial communities with the Biofert B-treated soils on days 15 and 30 ( Figures 3 c and d). On the other hand, the soils treated with commercial biofertilizers A and C remained and showed significant changes in the composition of rhizobacterial communities until the end of the experiment, as shown in Figure 3 a-d.
Conclusion
The PCR-DGGE analysis confirms the bacterial diversity in three commercial biofertilizers (Biofert A-C) is highly different. The Biolog data represent the metabolic profile of those microorganisms, revealing the significant difference in the catabolic capacity of microbial communities among commercial biofertilizers. However, the relativity of liquid biofertilizers (Biofert A and B) within either group indicates that the functional groups of microorganisms present in each biofertilizer might possess similar substrate utilization potential. Concerning their effect on bacterial communities in rhizosphere soils of avocados, the results demonstrated that the inoculation of commercial biofertilizers induces significant changes in the bacterial communities associated with the rhizosphere soils of avocados, particularly the soil treated with Biofert A and C. In contrast, Biofert B does not show significant changes in the bacterial composition on day 15 and day 30. To confirm this result, further studies have to be carried out to determine the efficiency of commercial biofertilizers in the composition of soil microbial communities other than bacteria (fungi and archaea) over long periods to develop sustainable agricultural practices for Chilean avocados.
Referencias
- Aguilar, R., Kelly, E. F., & Heil, R. D. (1988). Effect of cultivation on soils in northern Great Plains rangeland.
Soil Science Society of America Journal ,52 , 1081-1085. https://doi.org/10.2136/sssaj1988.03615995005200040034x - Azizoglu, U. (2019).
Bacillus thuringiensis as a biofertilizer and biostimulator: a mini-review of the little-known plant growth-promoting properties of Bt.Current Microbiology ,76 (11), 1379-1385. https ://doi.org/10.1007/s00284-019-01705-9 - Bonomelli, C., Celis, V., Lombardi, G., & Mártiz, J. (2018). Salt stress effects on avocado (
Persea americana Mill.) plants with and without seaweed extract (Ascophyllum nodosum ) application.Agronomy , 8(5), 64. https://doi.org/10.3390/agronomy8050064 - Compant, S., Van Der Heijden, M. G. A., & Sessitsch, A. (2010). Climate change effects on beneficial plant-microorganism interactions.
FEMS Microbiology Ecology ,73 (2), 197-214. https://doi.org/10.1111/j.1574-6941.2010.00900.x - Diacono, M., Persiani, A., Testani, E., Montemurro, F., & Ciaccia, C. (2019). Recycling agricultural wastes and by-products in organic farming: biofertilizer production, yield performance and carbon footprint analysis.
Sustainability ,11 (14), 3824. https://doi.org/10.3390/su11143824 - Díaz-Barrera, A., & Soto, E. (2010). Biotechnological uses of
Azotobactervinelandii : Current state, limits and prospects.African Journal of Biotechnology , 9(33), 5240-5250. - Ferrer-Pereira, H., Pérez Almeida, I., & Raymúndez Urrutia, M. (2017). Genetic characterization and diversity among avocado (
Persea americana Mill.) genotypes from INIA-CENIAP, Venezuela.Tree Genetics & Genomes ,13 (3), 56. https://doi.org/10.1007/s11295-017-1128-x - Flores, M., Saravia, C., Vergara, C. E., Avila, F., Valdés, H., & Ortiz-Viedma, J. (2019). Avocado oil: characteristics, properties, and applications.
Molecules ,24 (11), 2172. https://doi.org/10.3390/molecules24112172 - Foucher, A. L. J. L., Bongers, T., Noble, L. R., & Wilson, M. J. (2004). Assessment of nematode biodiversity using DGGE of 18S rDNA following extraction of nematodes from soil.
Soil Biology and Biochemistry ,36 (12), 2027-2032. https://doi.org/10.1016/j.soilbio.2004.05.021 - Glick, B. R. (2012). Plant growth-promoting bacteria: mechanisms and applications.
Hindawi Publishing Corporation, Scientific ,2012 , 963401. https://doi.org/10.6064/2012/963401 - Gomez, E., & Garland, J. L. (2012). Effects of tillage and fertilization on physiological profiles of soil microbial communities.
Applied Soil Ecology ,61 , 327-332. Doi tps: //doi.org/10.1016/j.apsoil.2011.10.008 - Guzmán-Rodríguez, L. F., Cortés-Cruz, M. A., Rodríguez-Carpena, J. G., Coria-Ávalos, V. M., & Muñoz-Flores, H. G. (2020). Biochemical profile of avocado (
Persea americana Mill.) foliar tissue and its relationship with susceptibility to mistletoe (Family Loranthaceae).Revista Bio Ciencias , 7, e492. https://doi.org/10.15741/revbio.07.e492 - Hammer, Ø., Harper, D., & Ryan, P. (2001). Past: Paleontological Statistics Software Package for Education and Data Analysis.
Palaeontology Electronic , 4(1), 4-9. - Insam, H., & Goberna, M. (2004). Use of Biolog® for the Community Level Physiological Profiling (CLPP) of environmental samples. In
Molecular Microbial Ecology Manual (2nd ed., Vol. 4.01, pp. 853-860). - Iwamoto, T., Tani, K., Nakamura, K., Suzuki, Y., Kitagawa, M., Eguchi, M., & Nasu, M. (2000). Monitoring impact of in situ biostimulation treatment on groundwater bacterial community by DGGE.
FEMS Microbiology Ecology ,32 (2), 129-141. Ttps://doi.org/10.1111/j.1574-6941.2000.tb00707.x - Jorquera, M. A., Hernández, M., Martínez, O., Marschner, P., & Luz Mora, M. (2010). Detection of aluminium tolerance plasmids and microbial diversity in the rhizosphere of plants grown in acidic volcanic soil.
European Journal of Soil Biology ,46 (3-4), 255-263. https://doi.org/10.1016/j.ejsobi.2010.03.005 - Li, B., Li, Y., Zhang, X., Wang, J., & Gao, M. (2015). Effects of chlortetracycline on soil microbial communities: Comparisons of enzyme activities to the functional diversity via Biolog EcoPlates™.
European Journal of Soil Biology ,68 , 69-76. https://doi.org/10.1016/j.ejsobi.2015.01.002 - Megali, L., Glauser, G., & Rasmann, S. (2014). Fertilization with beneficial microorganisms decreases tomato defenses against insect pests.
Agronomy for Sustainable Development ,34 (3), 649-656. https://doi.org/10.1007/s13593-013-0187-0 - Mitra, D., de los Santos-Villalobos, S., Parra-Cota, F. I., García Montelongo, A. M., Blanco, E. L., Lira, V. L., Olatunbosun, A. N., Khoshru, B., Mondal, R., Chidambaranathan, P., Panneerselvam, P., & Das Mohapatra, P. K. (2023). Rice (
Oryza sativa L.) plant protection by using dual biological control and plant growth-promoting agents-current scenarios and future prospects: A review.Pedosphere ,33 (2), 268-286. https://doi.org/10.1016/j.pedsph.2022.06.034 - Pérez, Á., Ávila, Q., & Coto, A. (2015). El aguacatero (
Persea americana Mill).Cultivos Tropicales ,36 (2), 111-123. - Peter, A. J., Amalraj, E. L. D., & Talluri, V. R. (2020). Commercial aspects of biofertilizers and biostimulants development utilizing rhizosphere microbes: Global and Indian scenario. In S. K. Sharma, U. B. Singh, P. K. Sahu, H. V. Singh, & P. K. Sharma, (Eds.),
Rhizosphere Microbes. Microorganisms for Sustainability (Vol. 23). Springer. https://doi.org/10.1007/978-981-15-9154-9_27 - Prajna, P., Kshitij, R., Gunjan, N., Aadil, M., Ravindra, P., Irfan, A., Kumar, A., & Singh, J. (2022). Plant-soil-microbes: A tripartite interaction for nutrient acquisition and better plant growth for sustainable agricultural practices.
Environmental Research ,214 (1), 113821. https://doi.org/10.1016/j.envres.2022.113821 - Schmidt, E. L., & Belser, L. W. (1982). Nitrifying bacteria, in methods of soil analysis part 2. In A. L. Page (Ed.), C
hemical and Microbiological Processes (pp. 1027-1042). ASA. https://doi.org/10.2134/agronmonogr9.2.2ed.c48 - Shrestha, P., Gautam, R., & Ashwath, N. (2019). Effects of agronomic treatments on functional diversity of soil microbial community and microbial activity in a revegetated coal mine spoil.
Geoderma ,338 , 40-47. https://doi.org/10.1016/j.geoderma.2018.11.038 - Shumaila, B., & Atia, I. (2019). Phosphate solubilizing rhizobacteria as alternative of chemical fertilizer for growth and yield of
Triticum aestivum (Var. Galaxy 2013).Saudi Journal of Biological Sciences ,26 (7), 1400-1410. https://doi.org/10.1016/j.sjbs.2018.05.024 - Somasegaran, P., & Hoben, H. J. (1994).
Handbook for Rhizobia: Methods in Legume-Rhizobium Technology . Springer. https://doi.org/10.1007/978-1-4613-8375-8 - Suprokash, K., Jung-Sheng, C, Bing-Mu, H., Jagat, R., Shih-Wei, H, Hua-Yi, C., Hussain, B., & Chan M. W. Y. (2022). Depth-resolved microbial diversity and functional profiles of trichloroethylene-contaminated soils for Biolog EcoPlate-based biostimulation strategy.
Journal of Hazardous Materials ,424 (127266). https://doi.org/10.1016/j.jhazmat.2021.127266 - USDA (2021a).
Avocado annual ,Chile . Report Number: CI2021-0026. - USDA (2021b).
Avocado annual ,Mexico . Report Number: MX2020-0049. - Ward, D. M., Bateson, M. M., Weller, R., & Ruff-Roberts, A. L. (1992). Ribosomal RNA analysis of microorganism as they occur in nature.
Advanced Microbial Ecology ,12 , 219-286. https://doi.org/10.1007/978-1-4684-7609-5_5