Abstract
Climate change contributes significantly to food insecurity, mainly through the impact on crop yields and the availability of essential resources such as irrigation water. This exploration involved evaluating meteorological factors and contrasting them with the scenarios described in the Representative Concentration Trajectories (RCP) 4.5 and 8.5 from a pluralistic approach in the Andean province of Tungurahua. A semi-structured questionnaire was administered to 244 agricultural practitioners to obtain primary data. The analysis included the Rasch model for psychometric evaluation, descriptive statistical methods, and qualitative content analysis. Several dimensions were covered, ranging from socioeconomic determinants and agronomic production metrics to food security indicators and farmers’ attitudes toward climate variability at different altitudes. Key findings indicate a notable impact of climate variability on agricultural production, attributed to factors such as frost, drought, excessive rainfall, and pests. The Rasch analysis revealed a relatively low risk of food insecurity, with a score of 0.74, suggesting adequate capacity for self-sufficiency. In addition, the perceptions and conditions reported by farmers showed significant alignment with the RCP 4.5 scenario projections. In conclusion, farmers’ perceptions provide valuable insights to integrate into climate change analyses. However, the study also acknowledges certain limitations vis-à-vis the accuracy of farmers’ recollections of past climate events. Therefore, the data reported in the research should be considered subjective.
Introduction
Climate variability severely threatens global food security, increasing the risk of a negative impact on the economy, society, environment, and health ( Davis et al., 2015 ). The agricultural sector is highly vulnerable to climate change, affecting global food security ( Viana et al., 2022 ). Scientific reports (1990 to 2013) have established that global temperatures increased between 1.1 °C and 0.2 °C since the pre-industrial era, with an average increase of 0.2 °C between 2011 and 2015 ( IPCC, 2019 ), causing an average 3.2 millimeters rise in sea levels, as well as a 40 % increase in CO 2 levels ( Shukman, 2019 ). Ecuador highlights the potential increase in extreme weather events, retreat of glaciers, rise in sea level, and decrease in annual runoff as negative consequences of climate change ( MAE, 2017 ). As a result, the agricultural sector in Ecuador faces significant economic losses, estimated to reach USD 5.6 MM by 2025 ( CEPAL & FAO, 2021 ; ONU, 2019 ).
The availability of research on the admissible impacts of meteorological variations in different regions and provinces of Ecuador is limited ( ENCC, 2012 ; Del Salto, Galvez & Regalado, 2018 ). Nonetheless, studies reveal a rise in the average annual temperature at the national level of 0.6 °C for the years 2011-2040, indicating an increase of up to 2.8 °C by the end of the century in an optimistic scenario ( García-Garizábal et al., 2017 ). The foremost aspects of climate change in Ecuador relate to changes in rainfall patterns, prolonged droughts, glacier retreats, and rising sea levels ( Pérez, 2016 ).
Extreme weather events will adversely affect agriculture conditions and farmers’ income, with a higher risk of abandonment, migration, and poverty ( Fagariba et al., 2018 ; Krishnamurthy et al., 2014 ; Yegbemey, 2021 ). Furthermore, it can exacerbate diseases, pests, and invasive species, leading to modifications in traditional practices related to the storage, transportation, and conservation of agricultural products ( FAO, 2017 ). Indeed, research shows that climate change can adversely affect the well-being of these communities ( Molotoks et al. 2021 ; UNDP, 2010 ; Vincent et al., 2011 ).
The impact of climate change on farmers’ behavior has far-reaching consequences for the well-being and conservation of culture, practices, knowledge, or biodiversity ( Joza Vera et al., 2022 ; Wheeler & Von Braun, 2013 ). Increasing food prices will lead to conventional agricultural practices where monocropping requires land extension to be implemented, and small farming will reduce their participation in markets ( Agrimonti et al., 2021 ).
Nonetheless, climate change can create opportunities, depending on the farmers’ abilities to interpret future scenarios ( Olesen & Bindi, 2002 ). Adopting diversification practices and agroforest models in temperate regions, such as the Andean Mountain range, can reduce the impact of climate variations ( Ochieng et al., 2016 ; Snowdon et al., 2021 ).
Identifying farmers’ decisions associated with strategies implemented under climate variation is necessary to implement integral actions to adapt to climate change. The increase of vegetation and green cover contribute to alternatives in rural zones to address the lack of water in paramos ( Eguiguren-Velepucha et al., 2016 ; Lozano & Moggiano, 2021 ). Hence, in 2050, the average annual temperature is expected to increase by 1.82 °C, potentially leading to a decrease of up to 10 % in annual water availability in the paramos ( Cadilhac et al., 2017 ; Geoinformática y Sistemas Cia. Ltda, 2015; Lascano, 2018 ; Toulkeridis et al., 2020 ). Thus, the average daily rainfall during 1961-2008 in the continental Ecuadorian territory was recorded at 5.47 mm/day. However, based on the Precis Scenario A2 model, the average values for 2010-2020 are projected to be 5.56 mm/day and 5.51 mm/day, respectively. Data reported depicts a trend of increasing precipitation levels, with a significant rise of up to 14.5 % expected in the 2050s ( Chimborazo & Vuille, 2021 ; MAE, 2017 ).
Conversely, Representative Concentration Pathways (RCP) act as guideposts for understanding the emissions, concentrations, and land-cover change projections based on distinct greenhouse gas emissions scenarios and land-use alterations ( Moss et al., 2010 ). The paramount significance of RCPs lies in their capacity to offer insights into probable future climate conditions, thus enabling informed preparative measures. As Van Vuuren et al. (2011 ) highlighted, RCP is an instrument for governments, industries, and communities to project potential climatic variations and adapt their methodologies. Sectors such as agriculture, for instance, can benefit immensely from anticipating potential changes in precipitation or temperature to ensure sustained productivity ( Challinor et al., 2014 ). By scrutinizing these pathways, policymakers can devise mitigation and adaptation strategies to tackle specific climate outcomes ( Clarke et al., 2007 ).
Some divergence between the scientific consensus on climate change and farmers’ knowledge has been noted, pointing to a potential gap in climate change communication and education ( Mase & Prokopy, 2014 ). The potential impacts of these perceptions on adaptation measures and decision-making are beginning to be examined, emphasizing the importance of locally specific climate information and communication within farming communities ( Deressa et al., 2011 ). With the advent of improved data collection techniques like remote sensing and machine learning, researchers now have more sophisticated methods to examine climate change’s spatial and temporal impacts on farming practices, thus furthering our understanding of these intricate relationships.
Studies have shown that farmers are more likely to recognize and express concerns about climate change if they have experienced its effects firsthand, such as changes in precipitation or temperature ( Arbuckle et al., 2013 ). Mertz et al. (2008 ) found that farmers in central Senegal perceive climate change through their experiences of climate variability, such as wind and occasional excess rainfall, which they identify as the most destructive climate factors. They attribute poor livestock health, reduced crop yields, and other problems to climate factors, especially wind.
Likewise, the literature explains how farmers’ perception (FP) is represented by changes in a period using a historical scenario as a parameter for perceived agroclimatic variations ( Fierro-González & López-Feldman, 2021 ). The measurement around perception has specific variables that could be used for understanding farmers’ dynamics. The case of farmers in the Nile basin of Ethiopia, analyzed by Deressa et al. (2011 ), identifies that temperature is an indicator of climate variation used for farmers. Some perception practices have a line of time to contrast past and present in a short- or long term-( ( Smit & Skinner, 2002 ). The information about climate variation and negative effects permits to farmers a compression of FP, and Menapace et al. (2015 ) describe a methodological approach (EM procedure) to evaluate the changes under farmers’ criteria. In other words, a scale is an adequate form to understand FP in some studies ( Soubry et al., 2020 ).
The current research analyzes FM in the cantons of Mocha, Tisaleo, and Píllaro regarding climatic variations using RCP climate change scenarios and the Rasch analysis for food security. In this case, the hypothesis is that FM of climate variation measures changes in terms similar to scientific reports. This study is significant as it aims to provide an in-depth examination of FP and how they determine the weather factors of variability, and on the other hand, if they are vulnerable to reducing their food security. This nuanced understanding is essential for developing tailored climate change adaptation strategies for these agricultural communities.
The findings are expected to enhance our comprehension of the farmers’ responses to adverse climatic conditions. Moreover, the emphasis promotes evaluating and contrasting these perceptions with established scientific scenarios. Both approaches are complementary and contribute significantly to the field, providing insights into climate change’s human and scientific dimensions. This dual perspective is instrumental in developing more effective and relevant adaptation and response strategies for the impacted agricultural communities.
Materials and Methods
Study Location
This study is based on the incorporation method as a determination of the most significant impacts of climate change on agricultural production in the cantons of Mocha, Píllaro, and Tisaleo. The case study took place in the central Andean area, Ecuador, where most of the population depends economically on agriculture, directly or indirectly. Tungurahua is a province with a higher influence on food security in the region, principally because its production feeds capital markets and some Amazonian provinces. Farmers have low access to land and water as resources for producing crops that are part of the food and sovereignty security. Maize, potatoes, beans, and an essential group of vegetables and fruits are part of the basket offered to satisfy product demand ( Figure 1 ).
The study was conducted during the pandemic in 2021 between July and December, focusing on cropping stages (harvesting and growing). The analysis observed distribution in three cantons engaged mainly in maize, potato, and fruit production. This priority is assumed because it is an important economic source for the farmers, a supply of food to the territory, and the principal income for their families. This area has a predominant climate modified by high mountains, which allows the cultivation of diversified crops at an altitude of 2,400 to 3,200 meters above sea level ( Figure 2 ).
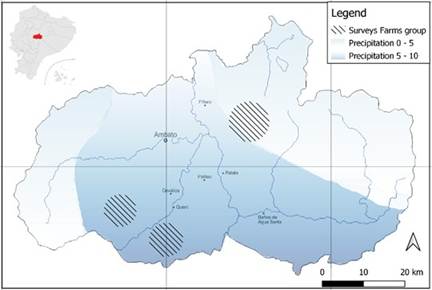
The landscape consists of volcanoes, mountains, plains, and valleys, so the climate is dry and temperate and the elevation influences in the climate and moderates the temperature in the productive zone.
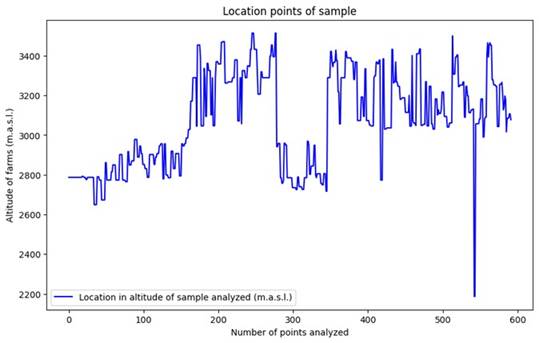
Surveys collected 2021.
Research Methodology
The present study adopts a positivist paradigm, which analyzes observable, measurable, and quantifiable phenomena using specific techniques, tools, and procedures by quantifying climate-related events in the agricultural sector, including the compilation of relevant data from databases and FM of climate change. The study instrument is a semi-structured questionnaire applied using a survey.
A systematic methodology for studying the FP of climate change in agriculture emphasizes the objective analysis of observable phenomena. Initially, the study quantifies climate-related events in the agricultural sector, which is achieved by analyzing measurable and quantifiable data. This includes compiling relevant data from databases to assess food security indicators and FM of climate change. The subsequent step hinges on whether these climate events are found to affect crop cycles and food availability. Subsequently, the methodology dictates surveying farmers to gain an understanding of their responses to adverse climatic conditions. This step is critical for examining the impacts of climate change on agriculture through a positivist lens, ensuring an objective examination and identification of specific variables and factors. The investigation then evaluates whether these climate changes influence farmers’ resilience and adaptive strategies.
Sample and Data Collection
The sample size was determined using the formula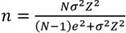 , where n represents the sample size, N represents the population size of 16,652 families of small farmers of the three cantons analyzed, Z represents the standard unit corresponding to the confidence level used (in this case, 1.96 for a 95 % confidence level), e represents the percentage of error (5 % or 0.05), and σ represents the standard deviation of the population. When the value of σ is unavailable, a constant value of 0.5 is typically used.
The statistical analysis yielded a sample size of 244 families (less than 1 hectare), deemed appropriate for the study’s objectives. The stratified sampling technique ensured that the sample was representative of the population of interest and allowed for more accurate estimates of parameters of interest.
In the initial stage, participants were selected from the communities in the specified cantons primarily involved in food production. These individuals, who were integral to capturing the community-level impact, were courteously informed about the purpose of the research and why they had been chosen as participants. For data collection, the study administered a detailed survey of the primary food producers within the households of these cantons. The instrument had three sections and 105 questions about agricultural practices, socioeconomic status, and climate change perceptions. The survey was designed to shed light on how these local communities are experiencing and coping with the adverse effects of climate change on food security. Each survey was handed directly to the household’s primary food producer, ensuring the information was as firsthand and reliable as possible.
The structure included a set of closed questions ( Table 1 ). The instrument addressed the families of the producers of the differentcantons to know the situation of food security in the sector and thus propose alternatives for improvement. Survey data was tabulated assuming values as a Likert scale for each response (0 to 3.5, or 7), according to each option and question. The validation was approved by the Cronbach’s alpha with a result of 0.82. This test used a correlation to determine the effective relation between survey questions.
Table 1 Description of variables included in the survey
| Componentes | Variables |
|---|---|
| Socioeconomic | Canton, family members, age, formal instruction, primary economic activity, secondary economic activity, monthly income, funding amount, use of financing |
| Climate change | Type of production, weather—colder, weather—wetter, weather—drier, weather—warmer |
| Perception | Rain last year, decreased yields—pests, decreased yields—frost, decreased yields—droughts, decreased yields—excessive rainfall, decreased yields—lack of irrigation water, consumption production, frequency of consumption, self-production—home feeding, type of drinking water |
Parallel to the survey-based data collection, a quantitative risk assessment Was conducted to identify climate change perception and production impacts. This probabilistic analysis used the Statistical Package for Social Sciences (SPSS) and R software. The software assisted in accurate and robust data analysis, allowing a clearer understanding of the projected challenges in the coming years.
RCP Scenarios and Perception Analysis
Moreover, the study incorporated RCP scenarios to evaluate the Climate Risk Index. The scenarios included the current climatic conditions, a moderate projection for 2022-2040 (RCP 4.5), and a more severe projection for the same period (RCP 8.5). These scenarios visually represented the varying levels of climate risk these territories face presently and in future projections.
The survey data was subsequently coded and categorized, enabling a direct comparison with specific indicators like temperature changes and extreme weather events as projected in the RCP scenarios. The analytical procedure involved quantitative and qualitative methods, including statistical correlations and thematic analyses, to gauge the alignment between localized perceptions and broader scientific forecasts. Using Mertz et al’s (2008 ) study, the description was compared with RCP data in a table for discussion.
Table 2 RCP scenarios forecasting in the central region of Ecuador according to IPPC (2019)
| Year range | Scenarios | ΔT (ºC) | Food safety analysis | |
| RCP 4.5 | RCP 8.5 | |||
| 2011–2040 | L | 0.62 | 0.62 | The Ecuadorian mountains experience an average annual temperature range of 8.1 and 10 °C. However, projections indicate this temperature could increase by 0.6 to 0.75 °C. As a result, rainfall may be reduced during certain times of the year, adversely impacting certain rainfed crops in the region. These findings have significant implications for agricultural planning and development, highlighting the importance of climate-smart practices and adaptation strategies to mitigate potential negative impacts. |
| M | 0.64 | 0.66 | ||
| S | 0.66 | 0.76 | ||
| 2041–2070 | L | 0.98 | 1.34 | The average annual temperature projected for 2041–2070 in the Ecuadorian highlands increases by 0.9 and 1.75 °C, so rainfall varies throughout the year, having months with little rainfall affecting crops in the area. |
| M | 1.16 | 1.54 | ||
| S | 1.31 | 1.75 | ||
| 2071–2100 | L | 1.53 | 2.49 | For the Sierra, the range of values would be higher by at least 1 °C by the end of the century, concerning the current behavior. The average annual temperature projected for 2071–2100 in the Ecuadorian mountains is an increase of 1.53 and 3.12 °C, being optimistic that rainfall would decrease by 2% and 10%. |
| M | 1.53 | 2.49 | ||
| S | 1.75 | 3.12 | ||
Source: Prepared by the authors.
Table 2 presents a detailed forecast outlining the projected temperature increases and their implications for food safety in the central region of Ecuador, as per the IPCC’s RCP 4.5 and 8.5 scenarios. The table covers three future periods-2011-2040, 2041-2070, and 2071-2100-and incorporates varying severity levels (Mild, Moderate, Severe) to provide a comprehensive view. Findings reveal an incremental rise in temperature across all severity levels and periods, with more severe impacts anticipated under the RCP 8.5 scenario. Particularly significant is the projected decrease in rainfall, which is expected to impact rain-fed agriculture, adversely affecting food security. This data underscores the pressing need for integrating climate-adaptive strategies and proactive agricultural planning to mitigate the potential negative repercussions of climate change on the region’s food security.
Advanced Analysis: Rasch Model
The Rasch model is a sophisticated statistical approach designed to standardize various values, allowing us to gauge performance more precisely based on the individual ability of the household and the difficulty level of the item being measured. The mathematical formulation of the Rasch model can be represented as Ln(Pni/(1−Pni)) =Di−BnLn(Pni/(1−Pni)) =Di−Bn, where Ln is the natural logarithm, Pni/(1−Pni)Pni/(1−Pni) is the odds ratio concerning item difficulty and household ability, and Di and Bn are logit paths related to the local origin of the latent variable under consideration.
The application of the Rasch model in our study is influenced by prior work conducted by Camargo G. et al. (2012 ), which attests to the utility and effectiveness of this method in social science research, including the realm of food security. Using the Rasch model, we aim to generate empirically substantiated, data-driven insights that could guide strategic interventions to enhance food security in the communities under study.
Results
Socioeconomic aspects of farmers describe a high presence of women, comprising 57.8 % of the farming community and primarily overseeing food production. Furthermore, the sector includes individuals aged forty and above, making up 98 % of our respondents. Educationally, most farmers have only completed primary education (51.6 %), with a mere 7.4 % reaching a university degree. Family units consist of 3 to 4 members and a significant 76.23 % of these families financially rely on the principal farmer, underscoring their pivotal socioeconomic role. Additionally, 88.5 % of the surveyed farmers engage in informal economic activities, eschewing state regulations.
presents a matrix of percentages delineating the interrelation between various climatic perceptions. Each entry elucidates the percentage of respondents who perceive a particular weather condition coinciding with a specific agricultural decrease. For instance, a staggering 82.40 % correlate colder weather with a decrease due to pests, suggesting a pervasive belief in the negative impact of cooler temperatures on pest proliferation. In contrast, warmer weather is associated with a decrease due to pests by a lesser fraction of 26.33 %, indicative of a less substantial linkage in the collective agronomic profile.
Table 3 Perception of climate and reduction of crops due to individual options
| Index | Colder weather | Weather humidity | Drier weather | Warmer weather | Weather—more rainy |
|---|---|---|---|---|---|
| Decrease due to pests | 82.4 | 68.98 | 21.32 | 26.33 | 12.34 |
| Decrease due to frost | 92.07 | 78.06 | 22.52 | 28.91 | 14.02 |
| Decrease due to drought | 96.29 | 80.67 | 24.07 | 29.53 | 14.6 |
| Decrease due to excessive rainfall | 94.75 | 79.8 | 23.47 | 28.73 | 14.35 |
| Average | 91.3775 | 76.8775 | 22.845 | 28.375 | 13.8275 |
A comparative analysis across the horizontal stratifications of the table reveals a salient pattern: colder weather and more humid conditions are consistently associated with higher percentages across all decremental categories. This trend peaks with decreases due to drought, where 96.29 % associate colder weather and 80.67 % associate more humid climates with drought-induced agricultural diminishment, paradoxically counterintuitive yet reflective of complex local environmental dynamics.
On the vertical spectrum, the percentage increases from pests to drought, suggesting a perceived compounding effect of climatic extremities on drought conditions due to the exacerbation of water scarcity amidst colder and more humid conditions, which could hamper water retention and utilization efficiency.
The column denoting “Weather-more rainy” uniformly presents the lowest percentages, indicating a perceived beneficial or less detrimental effect of increased precipitation on the specified agricultural decreases. This could be attributed to the mitigatory potential of ample rainfall on pests, frost, and drought conditions, notwithstanding the nuanced balance required to avert the adversities of excessive rainfall.
Figure 3 presents the altitudinal dispersion of agrarian establishments and delineates the interplay between meteorological perceptions and various diminution phenomena within agricultural yields. The analytical framework encapsulates a comprehensive altitudinal gradient, extending from approximately 2,800 to over 3,400 meters above sea level, thereby supplying an extensive overview of the orographic influences on farm productivity. Such a distribution suggests a non-discriminatory impact of cooler temperatures on agricultural outputs, irrespective of the farms’ elevation. Furthermore, Figure 3 integrates fixed horizontal delineations corresponding to the altitudes of specific urban centers such as Ambato, Tisaleo, Mocha, and Pillaro. These demarcations are benchmarks, anchoring the data within a recognizable topographical context and facilitating comparative analysis of rural and urban agro-climatic conditions.
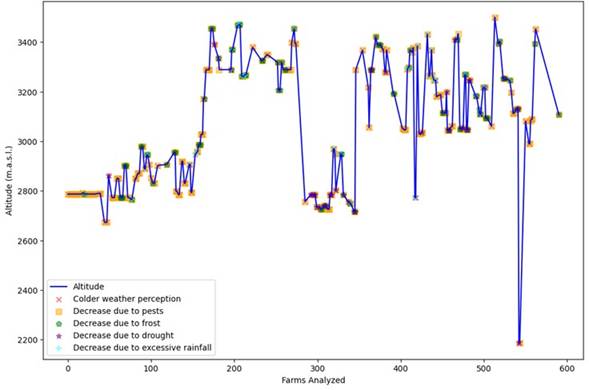
Figure 4 depicts a heterogeneous intensity distribution due to an agricultural phenomenon across an altitude gradient in the analyzed farms. Data points, color-coded to represent different intensity levels, suggest significant variability that does not appear to follow a clear linear trend concerning altitude. Higher intensities, indicated by yellow color as farms affected by climate change, are scattered across a range of altitudes, which could imply that factors other than altitude may influence the intensity of the observed phenomenon. However, a slight clustering of higher intensities at mid-range altitudes, particularly around 2,800 meters above sea level, indicates a moderate influence of altitude on the studied phenomenon.
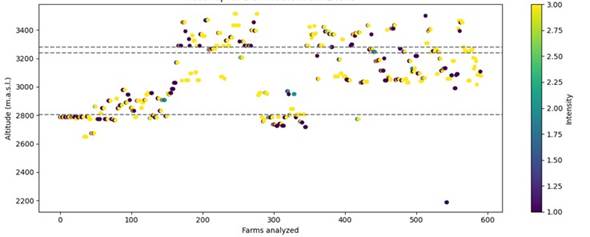
The assorted markers for diverse factors of agricultural decrease-namely pests, frost, drought, excessive rainfall, and overall yield reduction-do not correlate with specific altitudes within this visual representation. Instead, they appear interspersed throughout the range, showing a complex and potentially multifactorial relationship between altitude and these decremental agents.
Notably absent from the graphical representation are explicit visual indicates that encapsulate zones of heightened incidence, which have been accentuated through strategic circumscription or alternative highlighting techniques. Such an enhancement allows for a more immediate and intuitive recognition of areas where climatic effects on agricultural productivity are most pronounced.
According to climate change perception, Table 4 shows the results around food production, where the necessity for mobility to market produce, food self-sufficiency, and water supply is. Notably, most farmers (63.9 %) distribute between one and three parts of their produce for household consumption, while the same percentage sells seven to nine parts. This dual role of farming for both sustenance and economic gain underscores the multifaceted nature of agricultural practices in the studied region. The frequency of food consumption within these farming households revealed potential food deficits, with only 24.8 % consuming their produce daily. Interestingly, while 52.2 % of farmers must travel to other sectors to sell their produce, a substantial 85.81 % consider their production sufficient for household needs. The water supply situation is sub-optimal, with only 25 % having access to potable water, highlighting an area for urgent intervention.
Table 4 Analysis of FP around food production.
| Variable analyzed | Percentage (%) | Interpretation/Variation |
|---|---|---|
| Consumption of own produce | ||
| 1-3 parts for household consumption | 63.9 | The majority use a portion for household needs |
| 4-6 parts | 7.4 | |
| 7-9 parts | 2 | |
| All production | 16.9 | |
| Sale of products | ||
| 1 of 3 parts sold | 2 | A limited part is sold |
| 1-6 parts sold | 7.4 | |
| 7-9 parts sold | 63.9 | The majority of production is sold |
| All production sold | 3.5 | |
| Frequency of consumption | ||
| Monthly | 20.8 | Potential food deficit at home |
| Weekly | 44.8 | |
| Daily | 24.8 | |
| None | 9.6 | |
| Need for mobility to sell | ||
| Mobility to other sectors | 52.2 | The majority must travel to sell |
| No need for mobility | 28.2 | |
| N/A* | 19.6 | |
| Self-sufficiency in food production | ||
| Sufficient for household | 85.81 | The majority find it sufficient |
| Insufficient for household | 14.19 | |
| Water supply | ||
| Potable water | 25 | Limited access to potable water |
| Piped water | 73.1 | The majority rely on piped water |
| Well water | 1.4 | |
Source: Prepared by the authors.
Rasch Analysis
The following analysis includes two critical tables that employ Rasch modeling to assess various dimensions of food security quantitatively. Table 5 provides Rasch statistical parameters for each item related to food security, encompassing aspects such as the ability to buy food versus income, the distance required to purchase food, and the experience of hunger. These parameters are summarized through item ease (beta), standard estimation error, and confidence intervals. Table 6 extends this analysis by detailing the Rasch model’s difficulty, discrimination, and probability parameters for each question.
Table 5 Rasch statistical parameters
| Item ease parameters (beta) with IQ 0.95 | ||||
| Standard estimation | Error | Lower limit of CI | Upper limit of CI | |
| bility to buy food vs. income | -0.459 | 0.084 | -0.623 | -0.295 |
| Distance to buy food | 0.652 | 0.078 | 0.500 | 0.804 |
| Hunger | 1.572 | 0.089 | 1.397 | 1.746 |
| Self-production for home feeding | -1.297 | 0.102 | -1.497 | -1.097 |
| Family member sick in the last year | -0.468 | 0.084 | -0.632 | -0.304 |
Table 5 outlines Rasch statistical parameters, specifically focusing on item ease parameters (beta) along with their standard estimation error and confidence intervals (CI). The “Ability to buy food vs income” variable has a beta value of -0.459, suggesting that this item is easier for the population to endorse. The negative beta value could imply that higher income levels in the sample could be associated with greater ease in buying food. In contrast, the item “Hunger” has a higher positive beta value of 1.572, showing that experiencing hunger is less common within the sample. This would suggest that this item is ‘harder’ to endorse, likely because fewer people are experiencing this issue. Similarly, variables like “Distance to buy food” have a positive beta, pointing toward its relative difficulty within this population.
Table 6 Rasch’s analysis of each question.
| Dffclt Dscrmn P(x = 1|z = 0) | |||
| Lack of food | -178.34411 | 0.006010361 | 0.7449604 |
| Distance to buy food | -27.02643 | 0.006010361 | 0.5405206 |
| Ability to buy food vs. income | 159.65805 | 0.006010361 | 0.2769578 |
| Patients last year | 160.98617 | 0.006010361 | 0.2753621 |
| Self-production for home feeding | 299.45771 | 0.006010361 | 0.1418695 |
Table 6 presents the Rasch analysis of each question for difficulty (Dffclt), discrimination (Dscrmn), and the probability of a positive response when the latent trait is at zero (P(x = 1|z = 0)). For example, the “Lack of food” item has a high negative difficulty score of -178.34411 and a high probability score of 0.7449604, indicating that the item is challenging to endorse but has high discrimination power. It might also mean that when endorsed, this item can effectively differentiate between distinct levels of the latent trait, i.e., food security. .
According to the result schema, the most pertinent parameters are hunger levels and the distance needed to purchase food, with values of 0.74 and 0.54, respectively. Other variables in the study display a low index, registering values below 0.3. Together, these tables illuminate the complex landscape of food security by finding key parameters instrumental in understanding its various dimensions. These Rasch analysis findings offer a quantitative foundation for showing critical intervention and policy formulation areas.
Discussion
Farming is a practice with a vast knowledge background accumulated in farmers’ experience. The transmission of information supplies heritage and decision actions under risk scenarios, forming resilience and adaptation. The reduction of adult participation and generational change represents a concern for the sustainability of local agriculture, as younger generations show diminishing interest. Hence, this lack of formalization not only affects the quality and safety of agricultural products but also poses broader governance challenges. These findings amplify the need for targeted policy interventions, given the centrality of farmers-particularly women and older individuals-in regional food security and economic stability, especially when contextualized within the overarching issues of climate change impact and adaptation strategies.
The analyzed farms’ altitude does not show a significant relationship with climate perception and variation. Moreover, the results have coincided with Brazilian farmers where drought affects production, and their perception is focused on this evidence (Fierros-González & López-Fieldman, 2021). The scale (RCP) used in this study is an approach to understanding how FP adjusts to technical criteria. Similar studies such as Soubry et al.’s (2019) establish that FP produces information under specific time and climatic indicators parameters. Moreover, comparisons of FP with RCP scenarios promote the use of knowledge to include their participation in the next steps of information analysis on the climate crisis.
Our analysis, supported by literature and field observations, reveals a concerning alignment between the FPs and the projected outcomes of various RCP scenarios. Alotaibi (2023 ) states that climate change has detrimentally affected agricultural productivity, exacerbating food insecurity rates. The farmers in our study have noted marked shifts in temperature and precipitation patterns, including extended winter seasons and abbreviated, intensely hot summer seasons. These changes have culminated in drier conditions, escalated pest activity, and increased soil erosion, resonating with the expected consequences of climate change.
Table 7 presents a synthesis of the interlinked variables of climate change, RCP scenarios, and food security. The data reveal a distressing decline in climatic conditions over the past decade, significantly affecting agricultural outputs and, by extension, the livelihoods of farming families. The survey participants reported heightened adverse climatic factors such as increased cold spells, humidity, dryness, extreme temperatures, pest proliferation, soil erosion, and altered rainfall patterns. These observations align with the RCP 4.5 scenario, which envisions moderate future impacts. However, it is crucial to consider the potential ramifications of the RCP 8.5 scenario. Our findings suggest a trend toward this higher-consequence pathway, signaling an escalation to near-irreversible impacts on the community.
Contrasting these observations with RCP scenarios, there is a noticeable congruence between the farmers’ experiences and the moderate impacts predicted under RCP 4.5. However, the emerging trend toward the more severe impacts of RCP 8.5 raises significant concerns. This alignment shows that while the current observations are consistent with a moderate impact scenario, the trajectory veers toward a more severe impact scenario, necessitating immediate and targeted policy interventions. These policies should aim at bolstering agricultural resilience and enhancing food security while also considering the broader socioeconomic context of these farming communities.
Table 7 Perception of climate change in food security parameters in the Mochas, Píllaro, and Tisaleo cantons.
| Climate xhange Impact | RCP scenario | Food security impact | Detailed discussion |
| Global warming effects | RCP 8.5 Severe | Decreased agricultural output | The research indicates significant meteorological changes over recent decades in the cantons of Mocha, Píllaro, and Tisaleo. Increased occurrences of cold weather, humidity, dryness, and elevated temperatures have adversely affected non-traditional crops. The RCP 8.5 scenario is relevant here, considering moderate air pollutant emissions contributing to climate change. Temperatures in the central regions range from 8.1 to 10 °C and are projected to increase by 0.6 to 0.75 °C. This change significantly threatens food security and the social welfare of local farmers. |
| Harvest fluctuations | RCP 4.5 Moderate | Reduced food access and quality | The study reveals a marked decline in food access and availability in the area, impacting the dietary quality of many producers. A notable shift toward processed foods has occurred due to diminished fresh food consumption, driven by climate-induced harvest fluctuations. However, economic challenges limit access to processed foods for some. Additionally, the availability of potable water has become a critical issue in rural sectors. The RCP 4.5 scenario illustrates the relationship between land use, air pollution, and harvest outcomes in these regions. |
Producers have observed a significant shift in climate patterns compared to past periods in recent years. This observed variation aligns closely with the effects predicted in the RCP 4.5 scenario, moderately impacting farm production and climate conditions. Additionally, a majority of producers, approximately 66 %, report an increase in nocturnal rainfall. This observation aligns with Chuqui González’s (2022 ) research, which identified February to June as the wettest months, with November being the warmest. Despite these changes, it is crucial to highlight that producers continue to depend on traditional theories and practices from previous years for planning their crop-planting schedules.
Based on the analysis conducted, it is evident that climate change poses a significant risk to food production. The study evaluated the potential consequences of climate variations, focusing on the RCP 8.5 and 4.5 scenarios. The findings indicate that by 2040, there will be a moderate impact on climate, resulting in an annual temperature increase between 0.6 °C and 0.75 °C. Armenta et al. (2016 ) also conducted a study in Ecuador, highlighting that the RCP 8.5 scenario could lead to an increase of 0.8 °C between 2011 and 2040. Furthermore, the RCP 4.5 scenario could increase rainfall from 4 % to -15 %, with the Ecuadorian highlands experiencing an increase between 8 % and 10 %. These projections suggest a negative impact on food production, thus emphasizing the need for mitigation measures to be implemented. Camargo G. et al. (2012 ) set up the effectiveness of the Rasch model in assessing food security. Their research concludes that there is a moderate effect on food consumption and health. The instrument displays high reliability with a coefficient index of 0.98; in the present study, 0.975 was achieved. Consequently, it is imperative to adopt new climate mitigation strategies to prevent the escalation of food insecurity, bearing in mind future generations and the well-being of our planet.
Conclusions
The present study stresses the producers’ perceptions of climate change in the country’s central area, particularly in the Andean Mountain range. While recent climate changes are evident and align with scientific predictions, producers remain reliant on historical practices for agricultural planning, underscoring the need for integrating contemporary climatic data into traditional farming strategies. Likewise, the Rasch Model reveals a notable discrepancy between the altitude incidence and impact on farms, emphasizing the need to include more variables around farmers’ resilience in future studies. Moreover, the authorities’ lack of mitigation actions against climate change would exacerbate this situation, as indicated by a moderate RCP 4.5 scenario, which has considerable repercussions on climate change by decreasing water availability for irrigation and reducing sustainable practices such as soil regeneration and crop diversification. The future scenarios of RCP 8.5 and 4.5 prove that an average temperature increase of 0.6 °C to 0.75 °C is expected between 2022 and 2040 in the cantons Mocha, Píllaro, and Tisaleo. The producers’ perception has a set of factors incorporating climate variation, and there is not enough information to conclude a specific relationship with yield variation. The number of cold days and the humidity variation are factors associated with pest increase in some areas.
Nonetheless, it is necessary to reinforce the analysis of these points. Moreover, the estimation of adverse effects shows an understanding and an assumption from farmers, according to the moderate effects represented by the RCP 4.5 scenario. These findings have significant implications for the design and implementation of climate change policies and programs that prioritize the perspectives and experiences of local communities. Finally, this study demonstrates that climate change is a significant challenge affecting various aspects of the producers’ lives, particularly their food security, and warrants urgent action from authorities and stakeholders to mitigate its adverse effects.
Data availability statement: The data are available from the corresponding author.
Acknowledgments
The authors gratefully acknowledge support from the Technical University of Ambato (UTA) in Ecuador, especially the Dirección de Investigación y Desarrollo –DIDE.Authors’ Contributions
XI: registration of information in the field, construction of databases, preparation of the manuscript; CFC: design of methodologies, supervision of activities, analysis of information, and preparation of the manuscript; AV and IJ: analysis of information and preparation of the manuscript; CFC: supervision of activities and preparation of the manuscript, supervision of activities and preparation of the manuscript.Ethical Implications
This study was approved by the Ethics Committee of the Universidad Técnica de Ambato through document 0087-CU-P-2019, and Report PFCIAL-30.Conflict of Interest
The authors declare no conflicts of interest in this study.Funding
This work has been funded by the Dirección de Investigación y Desarrollo –DIDE of the Universidad Tecnica de Ambato.Referencias
- Agrimonti, C., Lauro, M., & Visioli, G. (2021). Smart Agriculture for Food Quality: Facing Climate Change in the 21st Century.
Critical Reviews in Food Science and Nutrition ,61 (6), 971-81. https://doi.org/10.1080/10408398.2020.1749555 - Alotaibi, M. (2023). Climate change, its impact on crop production, challenges, and possible solution”.
Notulae Botanicae Horti Agrobotanici Cluj-Napoca ,51 (1), 13020. https://doi.org/10.15835/nbha51113020 - Arbuckle, J. G., Morton, L. W., & Hobbs, J. (2013). Farmer beliefs and concerns about climate change and attitudes toward adaptation and mitigation: Evidence from Iowa.
Climatic Change ,118 (3-4), 551-563. https://doi.org/10.1007/s10584-013-0700-0 - Armenta, G., Villa, J., & Jácome, P. (2016).
Proyecciones climáticas de precipitación y temperatura para ecuador, bajo distintos escenarios de cambio climático . https://info.undp.org/docs/pdc/Documents/ECU/14%20Proyecciones%20de%20Clima%20Futuro%20para%20Ecuador%20en%20base%20a%20IPCC-AR5.pdf - Cadilhac, L., Torres, R., Calles, J., Vanacker, V., & Calderón, E. (2017). Desafíos parala investigación sobre el cambio climático en Ecuador.
Neotropical Biodiversity , 3(1), 168-181. https://doi.org/10.1080/23766808.2017.132824 - Camargo G., M. I., Quintero L., D. C., & Herrán F., F. 2012. Seguridad Alimentaria En Colombia y Modelo Rasch.
Revista Chilena de Nutricion ,39 (2), 168-79. https://doi.org/10.4067/S0717-75182012000200006 - CEPAL & FAO. (2021).
Perspectivas de La Agricultura y Del Desarrollo Rural En Las Américas: Una Mirada Hacia América Latina y El Caribe . - Challinor, A. J., Watson, J., Lobell, D. B., Howden, S. M., Smith, D. R., & Chhetri, N. (2014). A meta-analysis of crop yield under climate change and adaptation.
Nature Climate Change , 4(4), 287-291. https://doi.org/10.1038/nclimate2153 - Chimborazo, O., & Vuille, M. (2021). Present-Day Climate and Projected Future Temperature and Precipitation Changes in Ecuador.
Theoretical and Applied Climatology ,143 (3-4), 1581-97. https://doi.org/10.1007/s00704-020-03483-y - Chuqui González, J. A. (2022).
Proyecciones de los Índices de Cambio Climático en la Provincia de Tungurahua, al Año 2070 . Universidad Politécnica Salesiana. http://dspace.ups.edu.ec/handle/123456789/22898 - Clarke, L., Edmonds, J., Jacoby, H., Pitcher, H., Reilly, J., & Richels, R. (2007). Scenarios of greenhouse gas emissions and atmospheric concentrations. Sub-report 2.1A of Synthesis and Assessment Product 2.1 by the US Climate Change Science Program and the Subcommittee on Global Change Research. Department of Energy, Office of Biological & Environmental Research.
- Davis, J., O’Grady, A. P., Dale, A., Arthington, A. H., Gell, P. A., Driver, P. D., Bond, N., Casanova, M., Finlayson, M., Watts, R. J., Capon, S. J., Nagelkerken, I., Tingley, R., Fry, B., Page, T. J, & Specht, A. (2015). When Trends Intersect: The Challenge of Protecting Freshwater Ecosystems under Multiple Land Use and Hydrological Intensification Scenarios.
The Science of the Total Environment ,534 (November), 65-78. https://doi.org/10.1016/j.scitotenv.2015.03.127 - Deressa, T. T., Hassan, R. M., & Ringler, C. (2011). Perception of and adaptation to climate change by farmers in the Nile basin of Ethiopia.
The Journal of Agricultural Science ,149 (1), 23-31. https://doi.org/10.1017/S0021859610000687 - Eguiguren-Velepucha, P. A., Maita Chamba, J. A., Aguirre Mendoza, N. A., Ojeda-Luna, T. L., Samaniego-Rojas, N. S., Furniss, M. J., Howe, C., & Aguirre Mendoza, Z. H. (2016). Tropical Ecosystems Vulnerability to Climate Change in Southern Ecuador.
Tropical Conservation Science , 9(4). https://doi.org/10.1177/1940082916668007 - ENCC. (2012).
Estrategia Nacional de Cambio Climático Del Ecuador . - Fagariba, C., Song, S., & Soule, K. G. S. (2018). Factors Influencing Farmers ’ Climate Change Adaptation in Northern Ghana: Evidence From Subsistence Farmers in Sissala West, Ghana.
Journal of Environmental Science and Management ,21 (1), 61-73. https://doi.org/10.47125/jesam/2018_1/06 - FAO. (2017).
The Future of Food and Agriculture: Trends and Challenges. Food and Agriculture Organization of the United Nations . http://www.fao.org/3/a-i6583e.pdf - Fierro-González & López-Feldman, (2021). Farmers’ Perception of Climate Change: A Review of the Literature for Latin America.
Frontiers in Environmental Science , 9, 1-7. https://doi.org/10.3389/fenvs.2021.672399 - García-Garizábal, I., Romero, P., Jiménez, S., & Jordá, L. (2017). Evolución Climática En La Costa de Ecuador Por Efecto Del Cambio Climático.
Dyna ,84 (203), 37-44. https://doi.org/10.15446/dyna.v84n203.59600 - Geoinformática y Sistemas Cia. Ltda. (2015). Calidad del agua de los ríos en los páramos de tungurahua usando bioindicadores acuáticos. Informe de calidad de agua de los ríos en los páramos de tungurahua. Ecuador. https://docplayer.es/94586865-Geoinformatica-y-sistemas-cia-ltda.html
- IPCC. (2019).
Calentamiento Global de 1,5°C . https://www.ipcc.ch/site/assets/uploads/sites/2/2019/09/IPCC-Special-Report-1.5-SPM_es.pdf - Joza Vera, M. F., Ortiz Dueñas, X. F., Vizcaíno Salazar, G. J., & Párraga Acosta, J. S. (2022). Nutritional Strategies Implemented in Andean Countries. A Look at School Nutrition in Ecuador, Peru and Bolivia.
Nutricion Clinica y Dietetica Hospitalaria ,42 (1), 71-79. https://doi.org/10.12873/421joza - Krishnamurthy, P. K., Lewis, K., & Choularton, R. J. (2014). A Methodological Framework for Rapidly Assessing the Impacts of Climate Risk on National-Level Food Security through a Vulnerability Index.
Global Environmental Change ,25 (1), 121-32. https://doi.org/10.1016/j.gloenvcha.2013.11.004 - Lascano, M. C. (2018).
Análisis Del Cambio Climático y Su Incidencia En El Sector Agrícola En El Ecuador En El Año 2017 . Pontificia Universidad Católica del Ecuador. - Lozano, A., & Moggiano, N. (2021). El Cambio Climático En Los Andes y Su Impacto En La Agricultura : Una Revisión Sistemática.
Scientia Agropecuaria ,12 (1), 101-8. https://doi.org/10.17268/sci.agropecu.2021.012 - MAE. (2017).
Tercera Comunicación Nacional Del Ecuador . http://www.ambiente.gob.ec/wp-content/uploads/downloads/2017/06/TERCERA-COMUNICACION-WEB.pdf. - Mase, A. S., & Prokopy, L. S. (2014). Unrealized potential: a review of perceptions and use of weather and climate information in agricultural decision making.
Weather, Climate, and Society , 6(1), 47-61. https://doi.org/10.1175/WCAS-D-12-00062.1 - Menapace, L., Colson, G., & Raffaelli, R. (2015). Climate change beliefs and perceptions of agricultural risks: An application of the exchangeability method.
Global Environmental Change ,35 , 70-81. https://doi.org/10.1016/j.gloenvcha.2015.07.005 - Mertz, O., Mbow, C., Reenberg, A., & Diouf, A. (2008). Farmers’ Perceptions of Climate Change and Agricultural Adaptation Strategies in Rural Sahel.
Environmental Management ,43 (5), 804-816. https://doi.org/10.1007/s00267-008-9197-0 - Molotoks, A., Smith, P., & Dawson, T. P. (2021). Impacts of Land Use, Population, and Climate Change on Global Food Security.
Food and Energy Security ,10 (1), 1-20. https://doi.org/10.1002/fes3.261 - Moss, R. H., Edmonds, J. A., Hibbard, K. A., Manning, M. R., Rose, S. K., Van Vuuren, D. P., & Meehl, G. A. 2010. The next generation of scenarios for climate change research and assessment.
Nature ,463 (7282), 747-756. https://doi.org/10.1038/nature08823 - Ochieng, J., Kirimi, L., & Mathenge, M. (2016). Effects of Climate Variability and Change on Agricultural Production: The Case of Small Scale Farmers in Kenya.
NJAS - Wageningen Journal of Life Sciences ,77 (2016), 71-78. https://doi.org/10.1016/j.njas.2016.03.005 - Olesen, J., & Bindi, M. (2002). Consequences of Climate Change for European Agricultural Productivity.
Land Use and Policy ,16 , 239-62. https://doi.org/10.1016/S1161-0301(02)00004-7 - Organización de las Naciones Unidas. (2019). Informe de políticas de ONU-AGUA sobre el Cambio Climático y el agua.
UN-Water . - Pérez, B. F. 2016.
Estudio Sobre El Cambio Climático En La Provincia de Orellana .Gobierno Autónomo Descentralizado de La Provincia de Orellana . - Del Salto, M., Gálvez, H., & Regalado, J. (2018). Análisis del comportamiento climático de los últimos 30 años, en las costas de Esmeraldas, Manta y Puerto Bolívar durante la época húmeda.
Acta Oceanográfica Del Pacífico ,18 (11). - Shukman, D. (2019). Cambio Climático: El Hielo de Groenlandia Enfrenta ‘La Pena de Muerte.’
BBC . - Smit, B., & Skinner, M. (2002). Adaptation options in agriculture to climate change: A typology.
Mitigation and Adaptation Strategies for Global Change , 7, 85-114. https://doi.org/10.1023/A:1015862228270 - Snowdon, R. J., Wittkop, B., Chen, T. W., & Stahl, A. (2021). Crop adaptation to climate change as a consequence of long-term breeding.
Theoretical and Applied Genetics ,134 , 1613-1623. https://doi.org/10.1111/cts.12884 - Soubry, B., Sherren, K. & Thornton, T. (2020). Are we taking farmers seriously? A review of the literature on farmer perceptions and climate change, 2007-2018.
Journal of Rural Studies ,74 , 210-222. https://doi.org/10.1016/j.jrurstud.2019.09.005 - Toulkeridis, T., Tamayo, E., Simón-Baile, D., Reyes-Yunga, D. F., Viera-Torres, M., & Heredia, M. (2020). Cambio Climático Según Los Académicos Ecuatorianos - Percepciones versus Hechos.
La Granja. Revista de Ciencias de La Vida ,31 (1), 21-49. https://doi.org/10.17163/lgr.n31.2020.02 - UNDP. (2010). Designing Climate Change Adaptation Initiatives.
A UNDP Toolkit for Practitioners ,58 . http://www.adaptationlearning.net/sites/default/files/17750_CC_un_toolbox.pdf - Van Vuuren, D. P., Edmonds, J., Kainuma, M., Riahi, K., Thomson, A., Hibbard, K., & Rose, S. K. (2011). The representative concentration pathways: an overview.
Climatic change , 109(1-2), 5. https://doi.org/10.1007/s10584-011-0148-z - Viana, C. M., Freire, D., Abrantes, P., Rocha, J., & Pereira, P. (2022). Agricultural Land Systems Importance for Supporting Food Security and Sustainable Development Goals: A Systematic Review.
Science of the Total Environment ,806 , 150718. https://doi.org/10.1016/j.scitotenv.2021.150718 - Vincent, K., Wanjiru, L., Aubry, A., Mershon, A., Nyandiga, C., Cull, T., & Banda, K. (2011). Gender, Climate Change and Community-Based Adaptation.
Quaternary International ,184 (1), 202-204. https://doi.org/10.1016/j.quaint.2008.03.010 - Wheeler, T., & Von Braun, J. (2013). Climate Change Impacts on Global Food Security.
Science ,341 (6145), 508-13. https://doi.org/10.1126/science.1239402 - Yegbemey, R. N. (2021). Farm-Level Land Use Responses to Climate Change among Smallholder Farmers in Northern Benin, West Africa.
Climate and Development ,13 (7), 593-602. https://doi.org/10.1080/17565529.2020.1844129