Abstract
Recent research on maize root architecture has made significant progress, but further research is needed to optimize methods for efficient and accurate acquisition of root architecture data. This study aimed to assess the effectiveness of digital imaging for root phenotyping of Zea mays L. Field experiments were carried out at two locations in the province of Antioquia, Colombia, in 2019 and 2020 to analyze root architecture variables of 12 genotypes of maize. Two methodologies were used: manual phenotyping and digital image analysis. Pearson’s correlation coefficients among variables were estimated. Principal Component Analysis (PCA) was used to summarize and uncover clustering patterns in the multivariate data set. The results indicated correlations between diameter ( r = 0.94) and manually measured root diameter. The manually measured right and left root angles correlated with image-derived root angle at r = 0.92 and 0.88, respectively, and root length at r = 0.62. The PCA highlighted that the digital method explained the highest proportion of variation in root areas and diameters, while the manual method dominated in root angle variables. These results corroborate a feasible method to optimize root architecture phenotyping for research questions. This protocol can be adopted under the automatic analysis with REST software for acquiring images of variables associated with roots’ angle, length, and diameter.
Introduction
Structural variables of plant roots, spatial distribution, arrangement, and appearance of all root parts and types are collectively referred to as root system architecture (RSA) traits ( Kano et al., 2011 ; Voss-Fels et al., 2018 ). RSA affects soil resource acquisition, plant interactions, and nutrient cycling in agricultural systems ( Zhang et al., 2014 ), especially water and nutrient acquisition ( Rich & Watt, 2013 ). These characteristics can be described as geometric and topological measures of root shape at various scales, such as diameter, angles, and length of the entire root system ( Den et al., 2010 ). These variables can predict throughput under specific conditions, such as drought or low soil fertility ( Lynch & Brown, 2012 ). Therefore, plant throughput may benefit from improvements in the characterization of root architecture, including variation in variables as a function of genotype and environmental conditions ( Band et al., 2012 ; Shi et al., 2013 ). Root crown phenotyping has been used to improve understanding of soil resource acquisition by roots in crops such as soybean ( Glycine max L.), common bean ( Phaseolus vulgaris L.), cowpea ( Vigna unguiculata L.), wheat ( Triticum aestivum L.), and maize ( Zea mays L.) ( Le Marié et al., 2019 ; Trachsel et al., 2011 ; York & Lynch, 2015 ).
Root architectural phenotypes ( Lynch, 2011 ; Pieruschka & Poorter, 2012 ; York et al., 2013 ) describe phenotypic variables under genetic control and have essential roles in soil resource capture. They determine roots’ temporal and spatial distribution in specific soil domains and ability to obtain mobile and immobile resources ( Hirel et al., 2007 ; Lynch, 2019). For example, root growth angles, which determine the spatial spread of a root system, allow for nutrient scavenging in different soil strata (Lynch, 2011). Growth angle influences its distribution and depth and, thus, plant performance under water and nutrient deficit stress conditions ( Dathe et al., 2016 ). Zhan and Lynch (2015 ) indicate that roots’ length and density of lateral branching significantly affect plant performance in water and low-nitrogen-stressed environments, where longer and more dispersed lateral roots favor mobile nutrient capture due to less competition between plants for soil resources. Efforts to understand the structure of crop root systems have led to several digital solutions ( Lobet et al., 2013 ) capable of extracting root architecture characteristics under various conditions ( Fiorani et al., 2012 ) to standardize measurements and enhance their performance ( Seethepalli et al., 2018 ).
In recent decades, high-throughput phenotyping (HTP) has been widely adopted in crop species to examine and monitor biomass accumulation, photosynthetic efficiency, phytosanitary status, growth variables, and root architecture ( Fernandez et al., 2017 ). According to Panguluri and Kumar (2013 ), phenotyping involves characterizing the behavior of desired plant variables, and it is an emerging discipline in plant phenomics that aims to expand the scope, performance, and accuracy of variable estimates in vegetables ( Furbank, 2009 ).
HTP has advanced rapidly in response to the need to bridge the gap between genomic information and plant phenotype plasticity ( Campbell et al., 2018 ). In recent years, there has been a shift to image-based phenotyping to enable relatively high throughput and accurate measurements in different plant organs, including roots ( Seethepalli et al., 2018 ). The experimental setup of root phenotyping involves lower costs and does not require sophisticated technical skills or access to sophisticated equipment ( Mir et al., 2019 ). However, the ex-situ analysis method has several disadvantages, including ( i ) only two-dimensional root growth data, ( ii ) difficulty in phenotyping a large number of individuals, ( iii ) additional time in collecting samples taken to the laboratory for analysis ( DoVale & Fritsche-Neto, 2013 ). Therefore, combining digital scanning with computerized image analysis provides a faster and high-throughput method to evaluate root morphological patterns, including root length, diameter, and ramification (Mir et al., 2019). For this reason, implementing phenotyping by digital imaging is presented as an efficient method to collect quantitative plant data ( Klukas et al., 2014 ).
Image analysis approaches have been widely used as reliable and fast root phenotyping techniques. They are available through different programs, such as EZ-Rhizo ( Lobet et al., 2013 ), WinRhizo ( Abramoff et al., 2004 ), and REST ( Colombi et al., 2015 ). The optimal analysis programs are ImageJ ( Pound et al., 2012 ) and IJ_Rhizo ( Leitner et al., 2014 ). These allow the collection of reliable phenotypic data from roots, which is costly in time and resources and has become a limiting factor in breeding programs ( Kuijken et al., 2015 ). Therefore, there is a pressing need for semi-automated root phenotyping methods applicable at the field scale, relatively inexpensive to develop and operate, easily accessible, and fast enough to measure many individual replicates.
The development and validation of automated tools to improve and facilitate data collection associated with the root architecture is required for research programs. In this context, this paper aims to compare two root phenotyping methodologies in maize plants: (i) manual and (ii) based on digital images, as an automated analysis method using REST software to improve and facilitate data collection more efficiently in the phenotyping of maize roots ( Zea mays L).
This study focuses on maize root structure research progress and highlights the lack of integrated approaches for manual phenotyping and digital image analysis. Furthermore, it revolves around the importance of root structure traits and emphasizes the crucial role of root structure-related traits for the efficient uptake of soil resources and how these impact plant performance.
The question compares methodologies such as manual and digital image-based analysis using REST software to assess maize root architecture efficiently. A scientific hypothesis could state that digital images will significantly improve data collection efficiency and accuracy, providing faster and more accurate measurements than manual analysis.
Materials and Methods
| Left root angle (°) | RAL | Angle of the left lateral emerging from the central root path along the root |
| Right root angle (°) | RAR | Angle of the right lateral emerging from the central root path along the root |
| Number of basal roots (#) | NBR | Number of basal roots of the root |
| Number of adventitious roots (#) | NAR | Number of adventitious roots of the root |
| Adventitious root diameter (mm) | ADRD | Thickness of adventitious roots along the central root path |
| Basal root diameter (mm) | BRD or BDR | Thickness of basal roots along the central root path |
| Adventitious root length (cm) | ADRL | Length from the base of a root to the adventitious root system component |
| Root system length (cm). | RSL | Length from the base of a root to the basal root system component |
| Root angle opening (°) | RAO | Opening angle between left and right |
| Area (cm 2 ) | ARH | Area of all pixels derived from the root within the convex hull |
Experimental location
The experiments were conducted in two locations in Colombia. The first trial was established in the countryside on April 12, 2019, at La Selva Research Station, belonging to the Corporación Colombiana de Investigación Agropecuaria (Agrosavia), located in the Municipality of Rionegro, Antioquia (6º 08’ 07” N and 75º 25’ 03” W, 2,090 m.a.s.l.), in silt loam soil. The average temperature during the experiment was 21 °C, the annual rainfall was 1,086 mm, and the average relative humidity was 75 % (IDEAM, 2022).
The second trial was established in the field on October 8, 2019, at the Agricultural Station Cotové, which belongs to the Universidad Nacional de Colombia, located in the village of El Espinal, in the municipality of Santa Fe de Antioquia (6º 33’ 32” N and 77º 04’ 51” W, 540 m a.s.l.). The experiment was carried out in clayey-sandy loam soil. The average temperature during the experiment was 29 °C, 829 mm of precipitation was recorded during the five months of the experiments, and the average relative humidity was 71 % (IDEAM, 2022).
Plant Material
Twelve maize genotypes from Agrosavia’s breeding program were developed from recurrent selection processes. The genotypes are identified as MVE-093, MVE-056, MVE-097, MVE-038, MVE-039, MVE-078, MVC-114, MVE-081, MVE-016, MVE-068, MVC-159, and MVC-B01.
Experimental Design and Agronomic Management
A randomized complete block design was used at each location, with twelve treatments (maize genotypes) and three replications. The experimental unit consisted of two 5 m-long rows at 0.80 m between rows and 0.20 m between plants for an area of 8.32 m 2 . One plow pass and two harrow passes prepared the land in both locations.
Fertilization consisted of 50 kg ha -1 of 15-15-15 at planting and a second fertilization 35 days after planting (dap) with urea (46 % N) and KCl at a rate of 50 kg ha --1 . Spodoptera frugiperda was controlled with Karate Zeon CS (50-Lambdacyhalothrin) at 0.5 L ha --1 . Sprinkler irrigation was applied in Cotové. Weed control was made by chemical and manual means according to the requirements in the study area.
Experimental Sampling
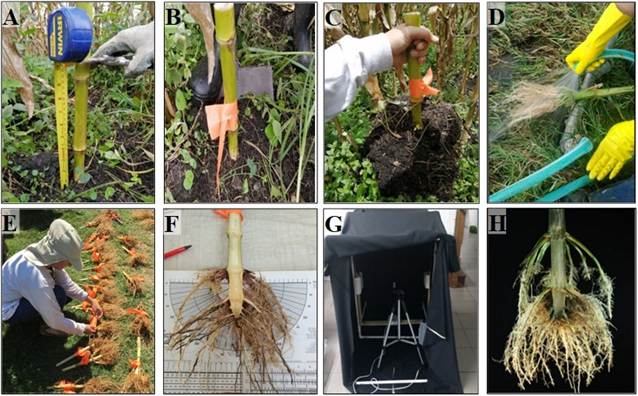
The root architecture was evaluated after the maize flowering stage (VT - R1). Root extraction and sampling were performed according to the recommendations of Colombi et al. (2015 ). Six representative, non-adjacent subsamples were from each plot’s middle row. Stalks were cut exactly 25 cm above the soil surface. The remaining stalk was split lengthwise with a knife along or across the row’s orientation. After cutting, both halves were dug out in a cylinder of around thirty-centimeter diameter and depth. Excess soil in the roots was removed with soap and water and stored to avoid changes in their structure/configuration until root system architecture traits (RSAT) analysis. Roots were studied manually, and images were taken at least five hours after extraction ( Figure 1 ).
Figure 1 Illustration of the Shovelomics protocol implemented in this study, according to Trachsel et al. (2011). A) Stem measurement at 25 cm; B) and C) Root excavation; D) Root cleaning; E) Longitudinal cutting and placement of labels on both sections; F) Evaluation of root variables using the ScoreBoard (SB); G) Equipment for digital image acquisition; H) Image of the root system for evaluation through the REST program, according to Colombi et al. (2015).
Manual Recording of Root System Architecture Characteristics (RSA)
Phenotypic root evaluation was performed using the root ScoreBoard (SB) developed by the Root Laboratory at Pennsylvania State University (https://plantscience.psu.edu/research/labs/roots). Table 1 presents a list of all root variables evaluated.
Table 1 Description of the variables evaluated in the root system architecture traits (RSAT) trials established in 2019. Descriptions modified from Colombi et al. (2015 ) Variables Abbreviation Description Left root angle (°) RAL Angle of the left lateral emerging from the central root path along the root Right root angle (°) RAR Angle of the right lateral emerging from the central root path along the root Number of basal roots (#) NBR Number of basal roots of the root Number of adventitious roots (#) NAR Number of adventitious roots of the root Adventitious root diameter (mm) ADRD Thickness of adventitious roots along the central root path Basal root diameter (mm) BRD or BDR Thickness of basal roots along the central root path Adventitious root length (cm) ADRL Length from the base of a root to the adventitious root system component Root system length (cm). RSL Length from the base of a root to the basal root system component Root angle opening (°) RAO Opening angle between left and right Area (cm 2 ) ARH Area of all pixels derived from the root within the convex hull Source: Prepared by the authors.
| Left root angle (°) | RAL | Angle of the left lateral emerging from the central root path along the root |
| Right root angle (°) | RAR | Angle of the right lateral emerging from the central root path along the root |
| Number of basal roots (#) | NBR | Number of basal roots of the root |
| Number of adventitious roots (#) | NAR | Number of adventitious roots of the root |
| Adventitious root diameter (mm) | ADRD | Thickness of adventitious roots along the central root path |
| Basal root diameter (mm) | BRD or BDR | Thickness of basal roots along the central root path |
| Adventitious root length (cm) | ADRL | Length from the base of a root to the adventitious root system component |
| Root system length (cm). | RSL | Length from the base of a root to the basal root system component |
| Root angle opening (°) | RAO | Opening angle between left and right |
| Area (cm 2 ) | ARH | Area of all pixels derived from the root within the convex hull |
Registration and Analysis of Root System Architecture (RSA) Feature Images Using REST Software (version 1.0.1)
We recorded images using a Nikon D5500 camera with 24.2 megapixels at the RC La Selva. A Canon REBEL T3i, with 18 megapixels, was used at the Agrarian Station in Cotové. The Root Estimator for Shovelomics Traits (REST, version 1.0.1 Institute of Agricultural Science, ETH Zurich, Switzerland) integrated with Matlab v.8.2 software (The MathWorks, Natick, Massachusetts, United States) was employed to analyze the images. A list of the root variables measured is presented in Table 2. Instructions for using the program can be found in the user manual of REST, version 1.0.1.
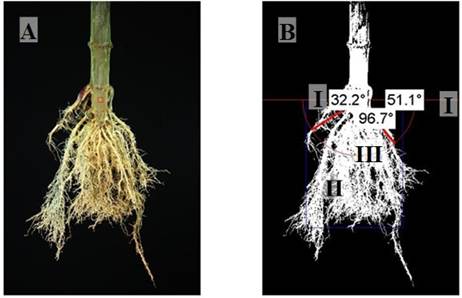
In order to reduce errors due to individual roots protruding from the rootstock, 5 % of root pixels on the bottom edge were discarded on the horizontal axis, and 2.5 % on each side on the vertical axis. Therefore, the analysis was based on the images comprising 90 % of the pixels classified as roots. An arc 10 cm in diameter from the center of the stem is established when running the program. The angle between the left and right outermost root was defined as the root opening angle ( Figure 2 B). Subsequently, a convex determined the maximum root width ( Figure 2 C).
Figure 2 Image processing with Root Estimator for Shovelomics Traits (REST): A) Original RGB image taken with 18 megapixels and segmented into binary images; B) I. Automated determination of upper root angle derived from the image, II. Correction of protruding roots by subtracting 2.5 % of the pixels on the left and right side and 5 % on the bottom of the rootstock, III. Determination of filling factor along the arc; C) I. Convex cap area and II. Maximum width. /
Statistical Analysis
Relationships between averages of RSA variables of manually evaluated genotypes and those derived from image analysis were analyzed using Pearson’s linear correlations ( p ≤ 0.01). Afterwards, a simple linear regression analysis was performed using:
y i = β 0 + β 1 x i + ε i (1)
Where y i represents the value of the response variable for the i-th observation, β 0 represents the intercept of the equation, β 1 is the gradient, x i is the value of the explanatory variable for the i th observation, and ε i represents the error for the i th observation that follows a normal distribution ∼ N (0,1). A principal component analysis (PCA) was also performed to study the relationships among variables for which the data were previously standardized.
Statistical analyses were performed using the R language, version 4.0.2. (R Development Core Team, 2020). The parameters of linear models with the ‘lm’ function were estimated. PCA was performed with the ‘gBiplot’ function.
Results and Discussion
Degree of Correlation Between Manual Method and Digital Image Use
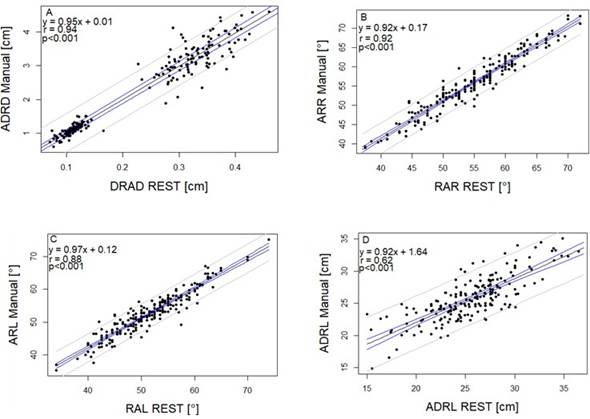
In order to validate the correlation among the variables, Pearson’s correlation coefficients and P values of the different variables recorded using imaging and manual measurements were estimated ( Figure 3 ). For this analysis, we considered only the variables adventitious roots diameter (ADRD), root angle left (RAL), root angle right (RAR), and adventitious roots length (ADRL), measured using both the SB and REST since they can be correlated between the methodologies used. Pearson’s correlation coefficients were highly significant ( P ≤ 0.001) between the variables, which ranged from 0.64 to 0.94. The manually measured ADRD correlated with the image-derived root diameter ( r = 0.94) ( Figure 3 A). The relationship between manually derived and image-based right angles was 0.92 ( Figure 3 B). Similarly, the RAL had correlation coefficients of 0.88 ( Figure 3 C).
Finally, REST-derived root-system length (RSL) correlated ( r = 0.62) with ADRL ( Figure 3 D). There are correlations between root variables under manual and image-based methods; these results highlight the possibility of replacing the manual collection of specific variables to speed up the phenotyping process in the field without losing valuable information.
The information extracted from the analysis of the digital images using REST allowed reliable comparisons with the results found with the manual method. The variables adventitious root diameter and right and left angle opening showed high values for the correlation coefficient ( r ≥ 0.94, p ≤0.01), thus highlighting the possibility of replacing the manual collection of specific variables with digital image analysis methods through specialized software such as REST to facilitate the large-scale phenotyping process. Bucksch et al. (2014 ), when comparing manual measurements of maize roots with those obtained by digital images, found significant negative correlations between crown angles ( r = -0.82) and root opening ( r = -0.62) due to the geometric constraint; the steeper the root angles to the soil line, the less width accumulated at the root opening level.
Few studies have compared digital image analysis scores with visual scores of the same trait, opting instead for comparisons to sensor-produced visual indices or alternative traits ( Bucksch et al., 2014 ; Burridge et al., 2016 ; Colombi et al., 2015 ; Guo et al., 2022 ; Kipp et al., 2014 ; Liu & Pattey, 2010 ). However, Guo et al. (2022) directly compared digital and visual scores, where the correlation analysis of validated traits, root angle of the youngest whorl and nodal root angle of the second youngest whorl, showed r > 0.84 and P < 0.001. Similarly, Das et al. (2015 ) stated that the provided validation between the manual method and the open-source phenomics platform “DIRT” reaffirmed known correlations of stem diameter ( r = 0.69, P < 0.0001), in addition to establishing new correlations for upper ( r = 0.87, P < 0.0001) and lower root angle ( r = 0.75, P < 0.0001). From a validation standpoint, Burridge et al. (2016) revealed significant correlations between DIRT and manual descriptors of bean root architecture, indicating which descriptors may be reasonable surrogates, such as tap root diameter ( r = 0.71, P = 0.01) and number of basal roots ( r = 0.51, P = 0.008). In each of these studies, digital scores were found to be effective at estimating the trait of interest (root angle and root diameter, respectively), corresponding to the results of the current study.
Figure 3 Simple linear correlation ( p ≤ 0.01) from mean values of maize genotypes evaluated for different root variables under manual phenotyping and digital imaging: A) Adventitious root diameter; B) Root angle right; C) Root angle left; D) Adventitious roots length. The blue lines represent the confidence bands, while the gray lines indicate a confidence level of 95 % (α = 0.05). /
Principal Component Analysis (PCA)
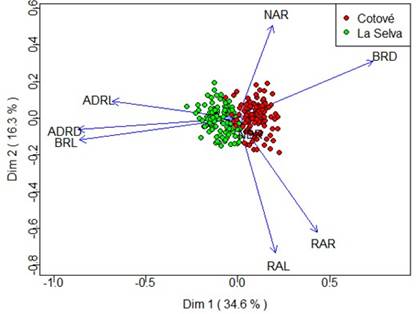
A PCA was performed to identify the linear combinations of the evaluated variables with the maximum multivariate variation for each of the methodologies used ( Figure 4 ).
The variation observed through PC1 and PC2 for manual phenotyping was 34.6 % and 16.3 %, respectively ( Figure 4 ). The clustering of observations according to the evaluation environment is evident due to the soil conditions in each locality, being able to infer the roots’ behavior for this data set. Cotové exhibited higher values for basal root diameter (BRD) and lower values for length (ADRL and BRL) and adventitious root diameter (ADRD). Regarding La Selva, Figure 4 shows higher values than Cotové for the variables ADRL, BRL, and ADRD and low values for BRD.
Figure 4 PCA from mean values of maize genotypes evaluated for different root variables under manual phenotyping. Abbreviations: adventitious root diameter (ADRD), basal root diameter (BRD), number of adventitious roots (NAR), root angle right (RAR), root angle left (RAL), adventitious root length (ADRL). /
Variables with the most significant contribution to the variance in the PC1 were BRD, ADRL, and RSL. On the other hand, PC2 displayed correlations for phenotypic variables, such as NBR, ADRL, RAL, and RAR (measured using REST).
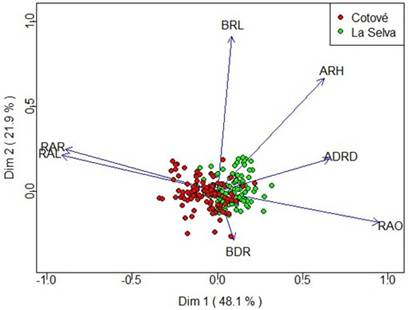
For phenotyping by digital imaging ( Figure 5 ), the first two principal components explained 48.1 % and 21.9 % of the total variation, respectively. ADRD, BRD, and ARH influenced PC1, while RAO, RAR, and RAL were associated with PC2.
PCA indicates that most of the variation found in PC1 for the data set is explained by the variables related to ADRL, BRL, and ADRD for the manual method and the area and ADRD for the digital method. In contrast, the digital and manual methods dominated the RAL and RAR for PC2. Seethepalli et al. (2018 ) obtained phenotypic data for soybeans, where the major contributing variables to PC1 were those related to total length, number of total roots, and diameter measurements. PC2 was dominated by root architecture angles, data that match our study. York and Lynch (2015 ) performed phenotyping of maize roots under two soil nitrogen conditions in the United States and South Africa. These authors point out size-related maize root variable-induced variance, where PC1 was influenced in both locations by nodal root diameter, while, in South Africa, lateral root length and stalk width also contributed significantly. PC2 was mainly influenced by distance to branching, lateral root branching density, and nodal root growth angle, indicating an underlying genetic basis causing correlations among all size-related variables. This implies a pleiotropic genetic control of several size-related root phenes as a general vector of root vigor for PC1 (York & Lynch, 2015). Hochholdinger and Tuberosa (2009 ) found that manually determined basal density and degree of secondary branching variables were independent of size-related variables. This observation suggests a different genetic program of lateral branching ( i.e. , initiation of lateral primordia and their subsequent emergence) independent of maize root vigor.
Figure 5 PCA from mean values of maize genotypes evaluated for different root variables under phenotyping with digital imaging. Abbreviations: adventitious root diameter (ADRD), basal root diameter (BRD), total root area (ARH), opening angle (RAO), root angle right (RAR), root angle left (RAL), adventitious root length (BRL).
Despite the promising results obtained in the correlation between the manual method and the use of digital images, it is crucial to acknowledge certain limitations in this study. Firstly, the evaluation focused on a specific set of variables, and extrapolating these findings to other root architectural characteristics may require additional validation. Moreover, field conditions, such as soil variability and climatic factors, could introduce uncontrolled variables that may impact the comparability of the methods. It is essential to consider these limitations when interpreting the results and generalizing the study’s conclusions.
This study lays the groundwork for future research that could expand and enhance the application of maize root phenotyping methods. Future perspectives may incorporate machine learning techniques to improve accuracy in identifying and measuring specific features. Additionally, implementing this approach under different growth conditions and maize varieties could provide a more comprehensive understanding of the method’s robustness and applicability. Exploring the integration of emerging technologies, such as remote sensing, could enable studies on a larger scale in real agricultural environments. These future investigations could contribute to the evolution of tools and methods for maize root phenotyping, optimizing efficiency and accuracy in root architecture analysis.
Conclusions
The strong correlations between digital and visual data show that automated root phenotyping can be adopted for angle opening, diameter, and length of adventitious roots, allowing an adequate phenotypic investigation. This will further increase the utility of REST for extensive genotype screenings of maize crops. These variables were also the ones that most influenced the PCA; variation in the first component showed the most variation in the variables related to diameter and length for the manual method. In contrast, root area and diameter explained the largest proportion of the total variation for the digital method. This technique requires only basic computer skills; thus, students, researchers, and others can use it. Finally, the results of this study clearly illustrated image processing as a phenotyping approach to maize roots.
Referencias
- Abramoff, M., Magalhães, P., & Ram, S. J. (2004). Image Processing with Image J.
Biophotonics International ,11 , 36-42. https://dspace.library.uu.nl/handle/1874/204900 - Band, R., Fozard, A., Godin, C., Jensen, E., Pridmore, T., Bennett, J., & King, R. (2012) Multiscale systems analysis of root growth and development: modeling beyond the network and cellular scales.
Plant Cell ,24 , 3892-3906. https://doi.org/10.1105/tpc.112.101550 - Bucksch, A., Burridge, J., York, L. M., Das, A., Nord, E., Weitz, J. S., & Lynch, J. P. (2014). Image-based high-throughput field phenotyping of crop roots.
Plant Physiology ,166 (2), 470-486. https://doi.org/10.1104/pp.114.243519 - Burridge, J., Jochua, C. N., Bucksch, A., & Lynch, J. P. (2016). Legume shovelomics: high-throughput phenotyping of common bean (
Phaseolus vulgaris L.) and cowpea (Vigna unguiculata subsp,unguiculata ) root architecture in the field.Field Crops Research ,192 , 21-32. https://doi.org/10.1016/j.fcr.2016.04.008 - Campbell, Z.C., Acosta-Gamboa, L. M., & Nepal, N. (2018). Engineering plants for tomorrow: how high-throughput phenotyping is contributing to the development of better crops.
Phytochem ,17 , 1329-1343. https://doi.org/10.1007/s11101-018-9585-x - Colombi, T., Kirchgessner, N., Le Marié, C. A., York, L. M., Lynch, J. P., & Hund, A. (2015). Next generation shovelomics: set up a tent and REST.
Plant Soil ,388 , 1-20. https://doi.org/10.1007/s11104-015-2379-7 - Das, A., Schneider, H., Burridge, J., Martinez, A., Wojciechowski, T., Topp, C., Lynch, J., Weitz, J., & Bucksch, A. (2015). Digital imaging of root traits (DIRT): a high-throughput computing and collaboration platform for field-based root phenomics.
Plant Methods ,11 , 51. https://doi.org/10.1186/s13007-015-0093-3 - Dathe, A., Postma, J. A., Postma-Blaauw, M. B., & Lynch, J. P. (2016). Impact of axial root growth angles on nitrogen acquisition in maize depends on environmental conditions.
Annals of Botany ,118 , 401-414. https://doi.org/10.1093/aob/mcw112 - Den, H. G., Van, I. G., Beeckman, T., & De, S. I. (2010). The roots of a new green revolution.
Trends in Plant Science ,15 (11), 600-607. https://doi.org/10.1016/j.tplants.2010.08.009 - DoVale, J. C., & Fritsche-Neto, R. (2013). Genetic control of traits associated with phosphorus use efficiency in maize by REML/BLUP.
Revista Ciência Agronômica ,443 , 554-563. https://doi.org/10.1590/S1806-66902013000300018 - Fernandez, M. G. S., Bao, Y., Tang, L., & Schnable, P. S. (2017). A high‐throughput, field‐based phenotyping technology for tall biomass crops.
Plant Physiology ,174 (4), 2008-2022. https://doi.org/10.1104/pp.17.00707 - Fiorani, F., Rascher, U., Jahnke, S., & Schurr, U. (2012). Imaging plants dynamics in heterogenic environments.
Current Opinion in Biotechnology ,23 (2), 227-235. https://doi.org/10.1016/j.copbio.2011.12.010 - Furbank, R. (2009). Plant phenomics: from gene to form and function.
Functional Plant Biology ,36 (10), 5-6. https://doi.org/10.1071/FPv36n11_FO - Guo, C., Liu, L., Zhang, K., Sun, H., & Zhang, Y. (2022). High-throughput estimation of plant height and above-ground biomass of cotton using digital image analysis and Canopeo.
Technology in Agronomy , 2-4. https://doi.org/10.48130/TIA-2022-0004 - Hirel, B., Le Gouis, J., Ney, B., & Gallais, A. (2007). The challenge of improving nitrogen use efficiency in crop plants: towards a more central role for genetic variability and quantitative genetics within integrated approaches.
Journal of Experimental Botany ,58 , 2369-2387. https://doi.org/10.1093/jxb/erm097 - Hochholdinger, T. R., & Tuberosa, R. (2009) Genetic and genomic dissection of maize root development and architecture.
Current opinion in Plant Biology ,12 (2), 172-177. https://doi.org/10.1016/j.pbi.2008.12.002 - IDEAM (Instituto de Hidrología, Meteorología y Estudios Ambientales). (2022).
Datos Hidrometeorológicos .Bogotá . https://n9.cl/r7z3a - Kano, M., Inukai, Y., Kitano, H., & Yamauchi, A. (2011). Root plasticity as the key root trait for adaptation to various intensities of drought stress in rice.
Plant Soil ,342 (1), 117-128. https://doi.org/10.1007/s11104-010-0675-9 - Kipp, S., Mistele, B., Baresel, P., & Schmidhalter, U. (2014). High-throughput phenotyping early plant vigour of winter wheat.
European Journal of Agronomy . 52, 271-278. https://doi.org/10.1016/j.eja.2013.08.009 - Klukas, C., Chen, D., & Pape, J. (2014). Integrated analysis platform: An open-source information system for high-throughput plant phenotyping.
Plant Physiology ,165 (2), 506-518. https://doi.org/10.1104/pp.113.233932 - Kuijken, P., Van Eeuwijk, A., Marcelis, M., & Bouwmeester, J. (2015). Root phenotyping: from component trait in the lab to breeding.
Journal of Experimental Botany ,66 (18), 5389-5401. https://doi.org/10.1093/jxb/erv239 - Le Marié, C. A., York, L. M., Strigens, A., Heinz, C., Giuliani, S., Lynch, J., & Hund, A. (2019). Shovelomics root traits assessed on the EURoot maize panel are highly heritable across environments but show low genotype-by-nitrogen interaction.
Euphytica ,215 (10), 173. https://doi.org/10.1007/s10681-019-2472-8 - Leitner, D., Felderer, B., Vontobel, P., & Schnepf, A. (2014). Recovering root system traits using image analysis exemplified by two-dimensional neutron radiography images of lupine.
Plant Physiology ,164 (1), 24-35. https://doi.org/10.1104/pp.113.227892 - Liu, J., & Pattey, E. (2010). Retrieval of leaf area index from top-of-canopy digital photography over agricultural crops.
Agricultural and Forest Meteorology ,150 , 1485-1490. https://doi.org/10.1016/j.agrformet.2010.08.002 - Lobet, G., Draye, X., & Périlleux, C. (2013). An online database for plant image analysis software tools.
Plant Methods , 9(1), 38. https://doi.org/10.1186/1746-4811-9-38 - Lynch, J. P. (2011). Root phenes for enhanced soil exploration and phosphorus acquisition: tools for future crops.
Plant Physiology ,156 (3), 1041-1049. https://doi.org/10.1104/pp.111.175414 - Lynch, J. P. (2019). Root phenotypes for improved nutrient capture: an underexploited opportunity for global agriculture.
New Phytologist ,223 (2), 548-564. https://doi.org/10.1111/nph.15738 - Lynch, J. P., & Brown, K. M. (2012). New roots for agriculture: exploiting the root phenome. Philosophical Transactions of the Royal Society B:
Biological Sciences ,367 (1595), 1598-1604. https://doi.org/10.1098/rstb.2011.0243 - Mir, R., Reynolds, M., Pinto, F., Khan, M. A., & Bhat, M. A. (2019). High-throughput phenotyping for crop improvement in the genomics era.
Plant Science ,282 , 60-72. https://doi.org/10.1016/j.plantsci.2019.01.007 - Panguluri, S. K., & Kumar, A. A. (2013). Phenotyping for Plant Breeding.
Springer New York, 73-109. https://doi.org/10.1007/978-1-4614-8320-5_3 - Pieruschka, R., & Poorter, H. (2012). Phenotyping plants: genes, phenes and machines.
Functional Plant Biology ,39 (11), 813-820. https://doi.org/10.1071/FPv39n11_IN - Pound, M. P., French, A. P., Wells, D. M., Bennett, M. J., & Pridmore, T. P. (2012). CellSeT: novel software to extract and analyze structured networks of plant cells from confocal images.
The Plant Cell ,24 (4), 1353-1361. https://doi.org/10.1105/tpc.112.096289 - R-Core Team. (2020). R:
A Language and Environment for Statistical Computing [Online]. R Foundation for Statistical Computing. - Rich, S. M., & Watt, M. (2013). Soil conditions and cereal RSA: review and considerations for linking Darwin and Weaver.
Journal of experimental botany , 64(5), 1193-1208. https://doi.org/10.1093/jxb/ert043 - Seethepalli, A., York, L. M., Almtarfi, H., Fritschi, F. B., & Zare, A. (2018). A novel multi-perspective imaging platform (M-PIP) for phenotyping soybean root crowns in the field increases throughput and separation ability of genotype root properties.
BioRxiv , 309161. https://doi.org/10.1101/309161 - Shi, L., Shi, T., Broadley, M. R., White, P. J., Long, Y., Meng, J., Xu, F., & Hammond, J. P. (2013). High-throughput root phenotyping screens identify genetic loci associated with root architectural traits in Brassica napus under contrasting phosphate availabilities.
Annals of Botany ,112 (2), 381-38. https://doi.org/10.1093/aob/mcs245 - Trachsel, S., Kaeppler, S. M., & Brown, K. M. (2011). Shovelomics: high throughput phenotyping of maize (
Zea mays L.) root architecture in the field.Plant Soil ,341 (1), 75-87. https://doi.org/10.1007/s11104-010-0623-8 - Voss-Fels, K. P., Snowdon, R. J., & Hickey, L. T. (2018). Designer Roots for Future Crops.
Trends in Plant Science ,23 (11), 957-960. https://doi.org/10.1016/j.tplants.2018.08.004 - York, L. M., & Lynch, J. P. (2015). Intensive field phenotyping of maize (
Zea mays L.) root crowns identifies phenes and phene integration associated with plant growth and nitrogen acquisition.Journal of Experimental Botany ,66 (18), 5493-5505. https://doi.org/10.1093/jxb/erv241 - York, L. M., Nord, E. A. & Lynch, J. P. (2013). Integration of root phenes for soil resource acquisition.
Frontiers in Plant Science , 4, 355. https://doi.org/10.3389/fpls.2013.00355 - Zhan, A., & Lynch, J. P. (2015). Reduced frequency of lateral root branching improves N capture from low-N soils in maize.
Journal of Experimental Botany ,66 (7), 2055-2065. https://doi.org/10.1093/jxb/erv007 - Zhang, C., Postma, J. A., York, L. M., Lynch, J. P. (2014). Root foraging elicits niche complementarity-dependent yield advantage in the ancient ‘three sisters’ (maize/bean/squash) polyculture,
Annals of Botany ,114 (8), 1719-1733. https://doi.org/10.1093/aob/mcu191